


Why build your own Shopify sales report?
Summary: Shopify's built-in "Total sales over time" report is a great starting point, but it can't be redefined, extended, or joined with data from outside Shopify. This guide shows you how to build a Shopify sales report with SQL, rebuilding that same report - gross sales, discounts, sales reversals, shipping, taxes and total sales - as SQL models that run directly against your own warehouse. It's built on Shopify's own event grain - the order_agreement log - which is what makes the numbers actually match the admin instead of drifting a few percent. It's written for BigQuery but ports cleanly to Snowflake or Redshift, and the same four-step pattern (understand the logic → write the SQL → deploy → visualize) works for the bonus sales-by-product template further down.
How Shopify calculates its sales metrics
Almost every mismatch between a hand-built report and the Shopify admin comes from one of two things: using a slightly different formula, or putting the right number on the wrong day. Shopify's sales report documentation pins down the formulas, so start there.
| Metric | Formula | Excludes |
|---|---|---|
| Gross sales | price × quantity | tax, shipping, discounts, reversals |
| Discounts | code, automatic and manual discounts, applied before tax | stored negative |
| Sales reversals | refunds, cancellations, order edits, exchanges | stored negative |
| Net sales | gross sales − discounts − reversals | tax, shipping |
| Total sales | net sales + shipping + duties + fees + taxes | — |
| AOV | (gross sales − discounts) ÷ orders | reversals, shipping, tax |
Three of those trip people up in practice:
- Gross sales is pre-everything. Not "revenue" in any accounting sense — no tax, no shipping, and crucially not net of discounts. If your gross looks high, check you haven't left tax in.
- Discounts and reversals are stored negative. So
net = gross + discounts + reversalsis plain addition. Subtract them again and you double-count. - AOV is measured before post-order adjustments. It uses gross-less-discounts, not total sales. Dividing
total_salesby orders is the single most common way to get a number that looks plausible and disagrees with Shopify.
"Sales reversal" is just Shopify's newer word for a return. The underlying data doesn't change — it's still a refund or an order edit, which is exactly what the order_agreement event stream your connector already syncs. Where the dashboard falls short is everything after that: you can't redefine a metric, extend it with your own logic, or blend in data from outside Shopify. Once the data is in your warehouse, each of those becomes SQL you own.
What you'll need
- Shopify synced to your warehouse via Weld. The sales report reads
order,order_agreement,order_agreement_sale,order_line,order_refund,order_line_refund,shopandlocation. The product model addsinventory_itemand its history table for COGS; the quick ranking template usesproduct. Connect them all with the Shopify connector. - History tables on
inventory_item, if you want point-in-time COGS. Enable them under Data Source → the stream → History tables. Without it, costs fall back to the current value and margin on old orders will be wrong. - Nothing to configure for timezones. Shopify reports in store-local time while the raw timestamps are UTC. The model reads your store's timezone from the
shoptable, so there's no literal to swap in. - A warehouse. Weld connects seamlessly to BigQuery, Snowflake and Redshift (all destinations are listed here). The examples are written in BigQuery SQL; the logic ports cleanly to the other two.
- Optional: a store to test against. You won't be able to reproduce our exact demo data, but you don't need to - point the templates at your own Shopify development or test store to see them working before you run them against production.
Here's how those tables sit inside Shopify's full data model - the same schema explorer from the Shopify connector page:
Click through to the full-page schema explorer to pan, zoom and search across every table and relationship.
How to build your Shopify sales report
This is the flagship template: Shopify's own "Total sales over time" report, rebuilt in SQL and deployed in your warehouse. The bonus template further down follows this same pattern.
Step 1: Understand the sales bridge logic
A Shopify sales report is really a bridge from gross sales down to total sales: start with gross sales, subtract discounts, subtract sales reversals to reach net sales, then add shipping, duties, fees and taxes back on top to reach total sales. Alongside that bridge you want orders and average order value (AOV) for the same period - which is exactly what Shopify's own "Total sales over time" report shows, and the report most merchants check first every morning.
  Gross sales        product price x quantity, before anything else
- Discounts          order- and line-level discounts (stored negative)
- Sales reversals    refunds, cancellations, edits (stored negative)
-----------------
= Net sales
+ Shipping charges
+ Duties
+ Additional fees
+ Taxes
-----------------
= Total sales
The part that trips almost everyone up is when each of those lands. Shopify's report is event-based: a refund belongs to the day the refund was processed, not the day the order was placed. That's what stops yesterday's chart from silently rewriting itself every time support refunds an old order.
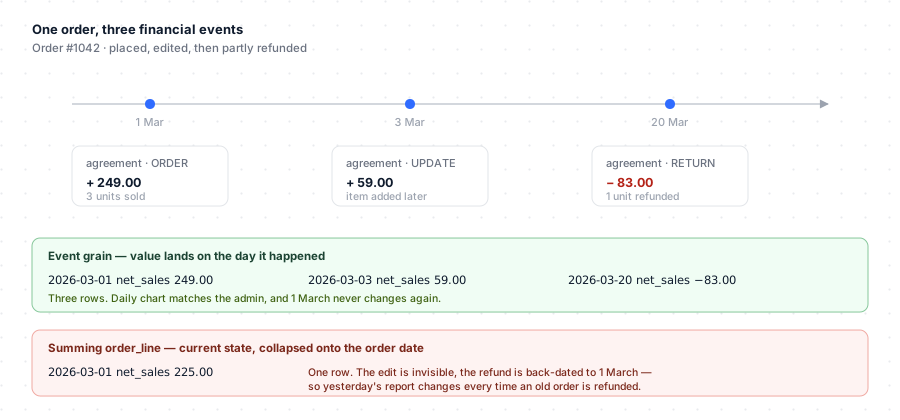
The same order, two ways. On the event grain it produces three rows on three days and 1 March is settled forever. Summed off order_line it produces one row of 225.00 on 1 March — the edit invisible, the refund back-dated — so last month's report quietly changes whenever someone processes an old refund.
Shopify exposes that event log through order agreements. Every change to an order's financial state creates an order_agreement, and each agreement carries the order_agreement_sale lines that changed. Two columns on those lines drive the entire report:
line_type | Feeds |
|---|---|
PRODUCT | Gross sales, discounts, net sales, units |
SHIPPING | Shipping charges |
DUTY | Duties |
FEE | Return and restocking fees |
GIFT_CARD | Gift card sales - deferred revenue, kept out of the sales equation |
ADJUSTMENT | Refund value Shopify can't tie to a specific product line |
action_type | Meaning | Counts as |
|---|---|---|
ORDER | The original sale | SALE |
UPDATE | An order edit that changed value | SALE |
RETURN | A refund or return | RETURN |
Every metric in the query below is just a cell from that grid, summed over a day.
Two sign conventions make the arithmetic work, and they're Shopify's own: discounts are negative and reversals are negative. So net_sales = gross_sales + discounts + returns is plain addition, and every BI tool aggregates it correctly with no special-casing.
Step 2: Write the SQL for the sales report
The model comes in four layers, each with one job:
raw.shopify.*        ELT output, untouched
  ↓
staging/*.sql        thin wrappers: cast, rename, drop test orders
  ↓
core/*.sql           the report - all the business logic lives here
  ↓
analytics/*.sql      a SELECT * your BI tool binds to
That's worth doing even for a single store. Staging means the casting and filtering
happen once instead of in every report - and it's where multi-store lives: each
staging model labels its rows with a shopify_store, so adding a second storefront
is a UNION ALL there and nothing else. shopify_store is already part of every
join key and of the grain in core, because order IDs are only unique within a
store. And the analytics layer exists for
indirection rather than transformation: dashboards bind to
analytics.shopify.sales_over_time, so you can rename a column or change the grain
in core without breaking anything downstream.
The complete model is core/sales_over_time.sql —
long, because reconciling with Shopify means handling order edits, gift cards,
store locations and presentment currencies. Below are the three parts
that carry the actual logic, taken straight from that file - so there is no
simplified-for-the-blog version to drift out of date. The complete model is
expandable at the end of this step if you'd rather read it all at once, and it's
also in the Shopify SQL template library
alongside every staging model it depends on.
First, the staging model for the agreement lines
(staging/order_agreement_sale.sql).
Note amount_ex_tax: Shopify's total_amount is tax-inclusive while every sales
component except taxes is not, so the subtraction happens once here rather than
in every consumer.
1-- staging.shopify.order_agreement_sale
2-- Line-level money per event, in both shop money (the store's base currency) and
3-- presentment money (what the customer actually paid in).
4--
5-- amount_ex_tax is derived here because total_amount is tax-inclusive while every
6-- sales component except taxes is not - computing it once avoids repeating the
7-- subtraction in every consumer.
8--
9-- Single store. To add another, UNION ALL a second block below pointing at that
10-- store's connector with a different shopify_store label. Keep it in staging so
11-- the core models never have to know how many stores there are.
12select
13    'store_1' as shopify_store
14  , cast(order_agreement_id as string) as order_agreement_id
15  , cast(order_id as int64) as order_id
16  , upper(cast(line_type as string)) as line_type
17  , upper(cast(action_type as string)) as action_type
18  , coalesce(cast(quantity as int64), 0) as quantity
19  , coalesce(
20        cast(total_amount_shop_money_amount as numeric)
21      , 0
22    ) as total_amount
23  , coalesce(
24        cast(total_tax_amount_shop_money_amount as numeric)
25      , 0
26    ) as total_tax
27  , coalesce(
28        cast(
29            total_discount_amount_before_taxes_shop_money_amount as numeric
30        )
31      , 0
32    ) as discount_before_tax
33  , coalesce(
34        cast(total_amount_shop_money_amount as numeric)
35      , 0
36    ) - coalesce(
37        cast(total_tax_amount_shop_money_amount as numeric)
38      , 0
39    ) as amount_ex_tax
40  , coalesce(
41        cast(total_amount_presentment_money_amount as numeric)
42      , 0
43    ) as presentment_total_amount
44  , coalesce(
45        cast(
46            total_tax_amount_presentment_money_amount as numeric
47        )
48      , 0
49    ) as presentment_total_tax
50  , coalesce(
51        cast(
52            total_discount_amount_before_taxes_presentment_money_amount as numeric
53        )
54      , 0
55    ) as presentment_discount_before_tax
56  , coalesce(
57        cast(total_amount_presentment_money_amount as numeric)
58      , 0
59    ) - coalesce(
60        cast(
61            total_tax_amount_presentment_money_amount as numeric
62        )
63      , 0
64    ) as presentment_amount_ex_tax
65  , upper(
66        cast(
67            total_amount_presentment_money_currency_code as string
68        )
69    ) as presentment_currency
70from
71    {{raw.shopify.order_agreement_sale}}
Then the event join. This is where the report becomes event-based: agreements
carry when, sale lines carry how much, and the order header carries the
dimensions. Two details matter — the timestamp is localised before being truncated
to a date, and an ORDER_EDIT within 90 seconds of checkout is treated as part of
the original purchase rather than a later restatement.
1joined as (
2    select
3        -- Localise BEFORE truncating to a date. happened_at is UTC while Shopify
4        -- reports in store-local time.
5        date(datetime(a.happened_at, s.report_timezone)) as date
6      , a.shopify_store
7      , a.order_id
8      , a.reason
9      , a.app_handle
10      , o.location_id
11      , o.source_name
12      , o.shop_currency
13      , sa.line_type
14      , sa.action_type
15      , sa.quantity
16      , sa.total_tax
17      , sa.discount_before_tax
18      , sa.amount_ex_tax
19      , sa.presentment_total_tax
20      , sa.presentment_discount_before_tax
21      , sa.presentment_amount_ex_tax
22      , -- An ORDER_EDIT within 90 seconds of creation is part of the original
23        -- purchase (a post-purchase upsell), not a later restatement.
24        case
25            when a.reason = 'ORDER_EDIT'
26            and timestamp_diff(a.happened_at, oft.order_created_at, second) <= 90 then true
27            else false
28        end as is_checkout_edit
29    from
30        agreements a
31        join shop s using (shopify_store)
32        join sales sa using (shopify_store, order_agreement_id, order_id)
33        join orders o using (shopify_store, order_id)
34        join order_line_flags olf using (shopify_store, order_id)
35        left join order_first_time oft using (shopify_store, order_id)
36    where
37        olf.has_product_title = 1
38) typed as (
39    select
40        *
41      , case
42            when action_type in ('ORDER', 'UPDATE') then 'SALE'
43            when action_type = 'RETURN' then 'RETURN'
44        end as report_row_type
45    from
46        joined
47    where
48        action_type in ('ORDER', 'UPDATE', 'RETURN')
49)
Then the sales equation itself, as aggregates over those events. This is the bridge from Step 1 expressed in SQL:
1-- RETURN rows carry negative amounts, so they reduce net sales on their
2-- own. ADJUSTMENT lines are refund value Shopify cannot tie to a product
3-- line (partial refunds, goodwill credits) - including them is what makes
4-- returns tie out.
5sum(
6    case
7        when report_row_type = 'SALE'
8        and line_type = 'PRODUCT' then amount_ex_tax
9        when report_row_type = 'RETURN'
10        and line_type in ('PRODUCT', 'ADJUSTMENT') then amount_ex_tax
11        else 0
12    end
13) as net_sales
14  , -- Same, excluding POST-ORDER edits: reconciles to the admin UI.
15sum(
16    case
17        when report_row_type = 'SALE'
18        and line_type = 'PRODUCT'
19        and (
20            reason != 'ORDER_EDIT'
21            or is_checkout_edit
22        ) then amount_ex_tax
23        when report_row_type = 'RETURN'
24        and line_type in ('PRODUCT', 'ADJUSTMENT') then amount_ex_tax
25        else 0
26    end
27) as net_sales_shopify_parity
28  , -- GREATEST guards negative discounts, which appear on some edit and
29-- return events and would otherwise inflate the total.
30(-1) * sum(
31    case
32        when report_row_type = 'SALE'
33        and line_type = 'PRODUCT' then greatest(discount_before_tax, 0)
34        else 0
35    end
36) as discounts
37  , sum(
38    case
39        when report_row_type = 'RETURN'
40        and line_type in ('PRODUCT', 'ADJUSTMENT') then amount_ex_tax
41        else 0
42    end
43) as returns
44  , sum(
45    case
46        when report_row_type = 'RETURN'
47        and line_type = 'ADJUSTMENT' then amount_ex_tax
48        else 0
49    end
50) as return_adjustments
51  , -- No row_type filter: shipping and fees occur on sales AND refunds, and a
52-- refunded shipping charge should reduce the total.
53sum(
54    case
55        when line_type = 'SHIPPING' then amount_ex_tax
56        else 0
57    end
58) as shipping_charges
59  , sum(
60    case
61        when line_type = 'DUTY' then amount_ex_tax
62        else 0
63    end
64) as duties
65  , sum(
66    case
67        when line_type = 'FEE' then amount_ex_tax
68        else 0
69    end
70) as return_fees
71  , cast(0 as numeric) as additional_fees
72  , sum(total_tax) as taxes
Everything else in the model is either a dimension (location, sales channel, country, fulfilment status) or a variant of these same sums — see what the full model adds below.
Show the complete model — all 470 lines, exactly as it runs
1-- shopify_sales_over_time - recreates Shopify's "Total sales over time"
2--
3-- Grain: day x store x order x location x channel x row type. Keeping row type
4-- in the grain means a day where an order both sells and refunds produces two
5-- rows, so the SALE and RETURN sides stay independently auditable.
6--
7-- Multi-store safe: order IDs are only unique WITHIN a store, so shopify_store is
8-- part of every join key and of the grain. Drop it from one join and rows fan out
9-- across storefronts silently.
10--
11-- Event-based: reads Shopify's order agreement log, so every financial change
12-- lands on the day it happened - returns on the refund date, order edits on the
13-- edit date. History does not restate itself when an old order is refunded.
14--
15-- Currency: shop money, plus the presentment amounts the customer actually paid.
16-- Timezone: read from the shop record, so nothing needs hardcoding.
17--
18-- Depends on: staging.shopify.order, .order_agreement, .order_agreement_sale
19 , -- .order_line, .order_refund, .order_line_refund, .shop, .location
20with
21 shop as (
22 -- Per store: currency and timezone both vary between storefronts.
23 select
24 shopify_store
25 , any_value(currency) as shop_currency
26 , coalesce(any_value(iana_timezone), 'UTC') as report_timezone
27 from
28 {{staging.shopify.shop}}
29 group by
30 shopify_store
31 )
32 , locations as (
33 select
34 shopify_store
35 , location_id
36 , location_name
37 , location_country_code
38 from
39 {{staging.shopify.location}}
40 )
41 , orders as (
42 select
43 o.shopify_store
44 , o.order_id
45 , o.order_name
46 , o.location_id
47 , o.source_name
48 , o.financial_status
49 , o.fulfillment_status
50 , o.cancelled_at
51 , -- The order's own currency wins over the shop's CURRENT currency, which
52 -- may have changed since. Deliberately NOT falling back to presentment
53 -- currency: that is what the customer was charged in, so using it here
54 -- would label shop-currency money with the buyer's currency. If none of
55 -- these is set, NULL is the honest answer - a guessed currency code
56 -- silently mislabels every amount on the row.
57 coalesce(
58 o.order_shop_currency
59 , o.currency
60 , s.shop_currency
61 ) as shop_currency
62 , -- Shipping country is the right geography, but it is NULL for digital
63 -- goods and POS. Cascade to billing, then the location's country.
64 coalesce(
65 o.shipping_country_code
66 , o.billing_country_code
67 , l.location_country_code
68 ) as country
69 from
70 {{staging.shopify.order}} o
71 join shop s using (shopify_store)
72 left join locations l using (shopify_store, location_id)
73 -- Only voided orders are dropped here: the money never existed. Everything
74 -- else stays, including 'pending' - an authorised-but-uncaptured order
75 -- (bank transfer, cash on delivery, manual payment) is a sale Shopify counts
76 , -- so excluding it here would understate every report downstream. Cancelled
77 -- and refunded orders also stay: their reversals arrive as their own RETURN
78 -- events, so removing the order would lose the sale AND the reversal.
79 -- financial_status and cancelled_at are passed through, so the analytics
80 -- layer can narrow this without core having destroyed the rows.
81 where
82 o.financial_status != 'voided'
83 )
84 , -- Orders carrying only untitled lines are dropped by Shopify's reports: deleted
85 -- products, draft-order custom lines, API artifacts. Flag at order level so a
86 -- partial order does not half-appear. Gift-card lines count as titled.
87 order_line_flags as (
88 select
89 shopify_store
90 , order_id
91 , max(
92 case
93 when is_gift_card
94 or product_title is not null then 1
95 else 0
96 end
97 ) as has_product_title
98 , logical_or(requires_shipping) as any_line_requires_shipping
99 from
100 {{staging.shopify.order_line}}
101 group by
102 shopify_store
103 , order_id
104 )
105 , agreements as (
106 select
107 shopify_store
108 , order_agreement_id
109 , order_id
110 , happened_at
111 , app_handle
112 , reason
113 from
114 {{staging.shopify.order_agreement}}
115 )
116 , sales as (
117 select
118 shopify_store
119 , order_agreement_id
120 , order_id
121 , line_type
122 , action_type
123 , quantity
124 , total_amount
125 , total_tax
126 , discount_before_tax
127 , amount_ex_tax
128 , presentment_total_amount
129 , presentment_total_tax
130 , presentment_discount_before_tax
131 , presentment_amount_ex_tax
132 , presentment_currency
133 from
134 {{staging.shopify.order_agreement_sale}}
135 )
136 , -- Earliest ORDER agreement per order, used to spot checkout-flow edits.
137 order_first_time as (
138 select
139 shopify_store
140 , order_id
141 , min(happened_at) as order_created_at
142 from
143 agreements
144 where
145 reason = 'ORDER'
146 group by
147 shopify_store
148 , order_id
149 )
150 , -- Shopify's own implied FX rate per order: presentment per 1 unit of shop money.
151 -- Using this beats converting shop money at your own daily rate, because Shopify
152 -- used its rate at checkout and yours will not match what the customer paid.
153 order_presentment as (
154 select
155 shopify_store
156 , order_id
157 , any_value(presentment_currency) as presentment_currency
158 , safe_divide(
159 sum(presentment_total_amount)
160 , nullif(sum(total_amount), 0)
161 ) as shopify_fx_rate
162 from
163 sales
164 group by
165 shopify_store
166 , order_id
167 )
168 , joined as (
169 select
170 -- Localise BEFORE truncating to a date. happened_at is UTC while Shopify
171 -- reports in store-local time.
172 date(datetime(a.happened_at, s.report_timezone)) as date
173 , a.shopify_store
174 , a.order_id
175 , a.reason
176 , a.app_handle
177 , o.location_id
178 , o.source_name
179 , o.shop_currency
180 , sa.line_type
181 , sa.action_type
182 , sa.quantity
183 , sa.total_tax
184 , sa.discount_before_tax
185 , sa.amount_ex_tax
186 , sa.presentment_total_tax
187 , sa.presentment_discount_before_tax
188 , sa.presentment_amount_ex_tax
189 , -- An ORDER_EDIT within 90 seconds of creation is part of the original
190 -- purchase (a post-purchase upsell), not a later restatement.
191 case
192 when a.reason = 'ORDER_EDIT'
193 and timestamp_diff(a.happened_at, oft.order_created_at, second) <= 90 then true
194 else false
195 end as is_checkout_edit
196 from
197 agreements a
198 join shop s using (shopify_store)
199 join sales sa using (shopify_store, order_agreement_id, order_id)
200 join orders o using (shopify_store, order_id)
201 join order_line_flags olf using (shopify_store, order_id)
202 left join order_first_time oft using (shopify_store, order_id)
203 where
204 olf.has_product_title = 1
205 )
206 , typed as (
207 select
208 *
209 , case
210 when action_type in ('ORDER', 'UPDATE') then 'SALE'
211 when action_type = 'RETURN' then 'RETURN'
212 end as report_row_type
213 from
214 joined
215 where
216 action_type in ('ORDER', 'UPDATE', 'RETURN')
217 )
218 , -- Shopify lumps cancellations, returns and refunds together; your business does
219 -- not. restock_type on the refunded lines tells them apart. Return rate measured
220 -- on RETURN alone is a product-quality signal; on all three it is noise.
221 refunds as (
222 select
223 r.shopify_store
224 , r.refund_id
225 , r.order_id
226 , date(datetime(r.refund_created_at, s.report_timezone)) as date
227 from
228 {{staging.shopify.order_refund}} r
229 join shop s using (shopify_store)
230 )
231 , refund_detail as (
232 select
233 r.shopify_store
234 , r.date
235 , r.order_id
236 , olr.restock_type
237 , olr.location_id
238 , sum(olr.quantity) as qty
239 from
240 {{staging.shopify.order_line_refund}} olr
241 join refunds r using (shopify_store, refund_id)
242 group by
243 1
244 , 2
245 , 3
246 , 4
247 , 5
248 )
249 , reversal_type as (
250 select
251 shopify_store
252 , date
253 , order_id
254 , case
255 when restock_type = 'cancel' then 'CANCELLATION' -- never shipped
256 when restock_type = 'return' then 'RETURN' -- came back, restocked
257 else 'REFUND' -- money back, no restock
258 end as reversal_type
259 from
260 refund_detail
261 -- The dominant restock type wins when one refund mixes them.
262 qualify
263 row_number() over (
264 partition by
265 shopify_store
266 , date
267 , order_id
268 order by
269 qty desc
270 , restock_type
271 ) = 1
272 )
273 , -- Carry the last known refund location forward so a multi-day return sequence
274 -- does not fragment across locations.
275 refund_location as (
276 select
277 shopify_store
278 , date
279 , order_id
280 , last_value(location_id ignore nulls) over (
281 partition by
282 shopify_store
283 , order_id
284 order by
285 date rows between unbounded preceding
286 and current ROW
287 ) as refund_location_id
288 from
289 (
290 select
291 shopify_store
292 , date
293 , order_id
294 , max(location_id) as location_id
295 from
296 refund_detail
297 group by
298 1
299 , 2
300 , 3
301 )
302 )
303 , agg as (
304 select
305 date
306 , shopify_store
307 , order_id
308 , location_id
309 , source_name
310 , shop_currency
311 , report_row_type
312 , -- MAX not SUM: one order is one order however many lines it has.
313 -- Excluding ORDER_EDIT stops an edited order counting again on the edit date.
314 max(
315 case
316 when report_row_type = 'SALE'
317 and line_type = 'PRODUCT'
318 and action_type = 'ORDER'
319 and reason not in ('RETURN', 'ORDER_EDIT') then 1
320 else 0
321 end
322 ) as orders
323 , -- 1. Net unit movement: sales minus returns.
324 sum(
325 case
326 when report_row_type = 'SALE'
327 and line_type in ('PRODUCT', 'GIFT_CARD') then quantity
328 when report_row_type = 'RETURN'
329 and line_type in ('PRODUCT', 'ADJUSTMENT') then quantity
330 else 0
331 end
332 ) as quantity
333 , -- 2. Strict units ordered: no returns, no edits. Matches the admin UI.
334 sum(
335 case
336 when report_row_type = 'SALE'
337 and line_type = 'PRODUCT'
338 and action_type = 'ORDER'
339 and reason not in ('RETURN', 'ORDER_EDIT') then quantity
340 else 0
341 end
342 ) as quantity_ordered_shopify_compat
343 , -- 3. Keeps checkout-flow edits, drops post-order edits. Matches Shopify's
344 -- CSV export, which differs from the UI.
345 sum(
346 case
347 when report_row_type = 'SALE'
348 and line_type in ('PRODUCT', 'GIFT_CARD')
349 and action_type = 'ORDER'
350 and reason != 'RETURN'
351 and (
352 reason != 'ORDER_EDIT'
353 or is_checkout_edit
354 ) then quantity
355 else 0
356 end
357 ) as quantity_ordered_shopify_export_parity
358 , -- RETURN rows carry negative amounts, so they reduce net sales on their
359 -- own. ADJUSTMENT lines are refund value Shopify cannot tie to a product
360 -- line (partial refunds, goodwill credits) - including them is what makes
361 -- returns tie out.
362 sum(
363 case
364 when report_row_type = 'SALE'
365 and line_type = 'PRODUCT' then amount_ex_tax
366 when report_row_type = 'RETURN'
367 and line_type in ('PRODUCT', 'ADJUSTMENT') then amount_ex_tax
368 else 0
369 end
370 ) as net_sales
371 , -- Same, excluding POST-ORDER edits: reconciles to the admin UI.
372 sum(
373 case
374 when report_row_type = 'SALE'
375 and line_type = 'PRODUCT'
376 and (
377 reason != 'ORDER_EDIT'
378 or is_checkout_edit
379 ) then amount_ex_tax
380 when report_row_type = 'RETURN'
381 and line_type in ('PRODUCT', 'ADJUSTMENT') then amount_ex_tax
382 else 0
383 end
384 ) as net_sales_shopify_parity
385 , -- GREATEST guards negative discounts, which appear on some edit and
386 -- return events and would otherwise inflate the total.
387 (-1) * sum(
388 case
389 when report_row_type = 'SALE'
390 and line_type = 'PRODUCT' then greatest(discount_before_tax, 0)
391 else 0
392 end
393 ) as discounts
394 , sum(
395 case
396 when report_row_type = 'RETURN'
397 and line_type in ('PRODUCT', 'ADJUSTMENT') then amount_ex_tax
398 else 0
399 end
400 ) as returns
401 , sum(
402 case
403 when report_row_type = 'RETURN'
404 and line_type = 'ADJUSTMENT' then amount_ex_tax
405 else 0
406 end
407 ) as return_adjustments
408 , -- No row_type filter: shipping and fees occur on sales AND refunds, and a
409 -- refunded shipping charge should reduce the total.
410 sum(
411 case
412 when line_type = 'SHIPPING' then amount_ex_tax
413 else 0
414 end
415 ) as shipping_charges
416 , sum(
417 case
418 when line_type = 'DUTY' then amount_ex_tax
419 else 0
420 end
421 ) as duties
422 , sum(
423 case
424 when line_type = 'FEE' then amount_ex_tax
425 else 0
426 end
427 ) as return_fees
428 , cast(0 as numeric) as additional_fees
429 , sum(total_tax) as taxes
430 , -- Returns detail block.
431 sum(
432 case
433 when report_row_type = 'RETURN'
434 and line_type in ('PRODUCT', 'ADJUSTMENT') then amount_ex_tax
435 else 0
436 end
437 ) as sales_reversals
438 , (-1) * sum(
439 case
440 when report_row_type = 'RETURN'
441 and line_type = 'PRODUCT' then discount_before_tax
442 else 0
443 end
444 ) as discount_reversals
445 , sum(
446 case
447 when report_row_type = 'RETURN' then total_tax
448 else 0
449 end
450 ) as tax_reversals
451 , sum(
452 case
453 when report_row_type = 'RETURN'
454 and line_type = 'SHIPPING' then amount_ex_tax
455 else 0
456 end
457 ) as shipping_reversals
458 , sum(
459 case
460 when report_row_type = 'RETURN'
461 and line_type in ('PRODUCT', 'ADJUSTMENT') then quantity
462 else 0
463 end
464 ) as reversed_quantity
465 , -- Gift cards are deferred revenue, kept out of the sales equation.
466 sum(
467 case
468 when line_type = 'GIFT_CARD' then amount_ex_tax + greatest(discount_before_tax, 0)
469 else 0
470 end
471 ) as gift_card_gross_sales
472 , sum(
473 case
474 when line_type = 'GIFT_CARD' then amount_ex_tax
475 else 0
476 end
477 ) as gift_card_net_sales
478 , (-1) * sum(
479 case
480 when line_type = 'GIFT_CARD' then greatest(discount_before_tax, 0)
481 else 0
482 end
483 ) as gift_card_discounts
484 , sum(
485 case
486 when line_type = 'GIFT_CARD' then total_tax
487 else 0
488 end
489 ) as gift_card_taxes
490 , -- Presentment money: what the customer actually paid, before any
491 -- conversion of ours.
492 sum(
493 case
494 when report_row_type = 'SALE'
495 and line_type = 'PRODUCT' then presentment_amount_ex_tax
496 when report_row_type = 'RETURN'
497 and line_type in ('PRODUCT', 'ADJUSTMENT') then presentment_amount_ex_tax
498 else 0
499 end
500 ) as presentment_net_sales
501 , sum(presentment_total_tax) as presentment_taxes
502 from
503 typed
504 group by
505 1
506 , 2
507 , 3
508 , 4
509 , 5
510 , 6
511 , 7
512 )
513select
514 a.date
515 , a.shopify_store
516 , a.order_id
517 , o.order_name
518 , a.report_row_type
519 , a.shop_currency
520 , o.country
521 , a.source_name
522 , -- The order's own location, straight from Shopify. NULL means Shopify
523 -- recorded no location - usually an online-store order - and is left NULL
524 -- rather than labelled, because "no physical location" is not the same claim
525 -- as "online". Identical expression in product_sales_over_time, so the two
526 -- models reconcile on this dimension.
527 own_loc.location_name as location_name
528 , -- Where a refund was processed, which is often NOT where the order was
529 -- placed: a POS sale returned through the web admin has a store
530 -- location_name and no refund location. Kept as its own column rather than
531 -- coalesced into location_name - they are two different facts, and merging
532 -- them makes it impossible to ask either question. NULL on SALE rows.
533 rf_loc.location_name as refund_location_name
534 , -- Shopify's own channel value, not an interpretation of it: 'web' for the
535 -- online store, 'pos' for retail, 'shopify_draft_order' for manual orders
536 , -- otherwise the handle of the app or marketplace that created the order.
537 -- Split retail from online with this, or with location_name IS NOT NULL.
538 lower(a.source_name) as sales_channel
539 , -- An order of only digital goods never gets a fulfillment status, which reads
540 -- as "unfulfilled" in every dashboard and panics ops. Distinguish it.
541 case
542 when o.fulfillment_status is null
543 and olf.any_line_requires_shipping = false then 'fulfillment_not_required'
544 else o.fulfillment_status
545 end as fulfillment_status
546 , o.financial_status
547 , rt.reversal_type
548 , o.cancelled_at is not null as is_cancelled
549 , a.orders
550 , -- Exactly ONE row per order, on its first SALE day. Summing over any window
551 -- gives "orders placed", the AOV denominator Shopify uses. Counts edit-only
552 -- orders with no ORDER row, ignores return-only orders, and never
553 -- double-counts across locations or days.
554 case
555 when a.report_row_type = 'SALE'
556 and row_number() over (
557 partition by
558 a.shopify_store
559 , a.order_id
560 order by
561 case
562 when a.report_row_type = 'SALE' then 0
563 else 1
564 end
565 , a.date asc
566 , a.location_id asc
567 , a.source_name asc
568 ) = 1 then 1
569 else 0
570 end as is_order_placed
571 , a.quantity
572 , a.quantity_ordered_shopify_compat
573 , a.quantity_ordered_shopify_export_parity
574 , -- discounts and returns are stored negative, so subtracting adds them back.
575 round(a.net_sales - a.discounts - a.returns, 2) as gross_sales
576 , round(a.discounts, 2) as discounts
577 , round(a.returns, 2) as returns
578 , round(a.return_adjustments, 2) as return_adjustments
579 , round(a.net_sales, 2) as net_sales
580 , round(a.net_sales_shopify_parity, 2) as net_sales_shopify_parity
581 , round(a.shipping_charges, 2) as shipping_charges
582 , round(a.duties, 2) as duties
583 , round(a.return_fees, 2) as return_fees
584 , round(a.additional_fees, 2) as additional_fees
585 , round(a.taxes, 2) as taxes
586 , -- Matches the Shopify admin UI.
587 round(
588 a.net_sales + a.shipping_charges + a.duties + a.return_fees + a.additional_fees + a.taxes
589 , 2
590 ) as total_shopify_sales
591 , -- Excludes tax and duties (pass-through money); what finance usually wants.
592 round(
593 a.net_sales + a.shipping_charges + a.return_fees + a.additional_fees
594 , 2
595 ) as total_sales
596 , round(a.sales_reversals, 2) as net_sales_reversals
597 , round(a.sales_reversals - a.discount_reversals, 2) as gross_sales_reversals
598 , round(
599 a.sales_reversals + a.tax_reversals + a.shipping_reversals + a.return_fees
600 , 2
601 ) as total_sales_reversals
602 , round(a.discount_reversals, 2) as discount_reversals
603 , round(a.tax_reversals, 2) as tax_reversals
604 , round(a.shipping_reversals, 2) as shipping_reversals
605 , a.reversed_quantity
606 , round(a.gift_card_gross_sales, 2) as gift_card_gross_sales
607 , round(a.gift_card_net_sales, 2) as gift_card_net_sales
608 , round(a.gift_card_discounts, 2) as gift_card_discounts
609 , round(a.gift_card_taxes, 2) as gift_card_taxes
610 , round(a.taxes - a.gift_card_taxes, 2) as taxes_excluding_gift_cards
611 , -- What the customer actually paid, and the rate Shopify used at checkout.
612 op.presentment_currency
613 , round(a.presentment_net_sales, 2) as presentment_net_sales
614 , round(a.presentment_taxes, 2) as presentment_taxes
615 , op.shopify_fx_rate
616from
617 agg a
618 join orders o using (shopify_store, order_id)
619 join order_line_flags olf using (shopify_store, order_id)
620 left join order_presentment op using (shopify_store, order_id)
621 left join reversal_type rt on rt.shopify_store = a.shopify_store
622 and rt.order_id = a.order_id
623 and rt.date = a.date
624 left join refund_location rf on rf.shopify_store = a.shopify_store
625 and rf.order_id = a.order_id
626 and rf.date = a.date
627 left join locations rf_loc on rf_loc.shopify_store = a.shopify_store
628 and rf_loc.location_id = rf.refund_location_id
629 left join locations own_loc on own_loc.shopify_store = a.shopify_store
630 and own_loc.location_id = a.location_id
631order by
632 a.date
633 , a.shopify_store
634 , a.order_id
635 , a.report_row_typeWhy the agreement log and not
order_line?order_lineis a current-state table: it tells you what an order looks like right now, and cannot express when its value changed. Sum it and returns get netted back to the original order date, order edits vanish, and yesterday's chart quietly rewrites itself every time someone refunds an old order. It's the most common reason a hand-built sales report drifts from the admin. Useorder_linefor product identity - SKU, title, variant - and the agreement log for anything time-based.On AOV: there's no
average_order_valuecolumn. At order grain it would be meaningless on a single row, so the model gives youis_order_placedinstead - exactly one row per order on its first SALE day. Divide in your BI tool:SUM(gross_sales + discounts) / SUM(is_order_placed), which is Shopify's own definition (gross less discounts, over orders) rather than dividing total sales by orders.
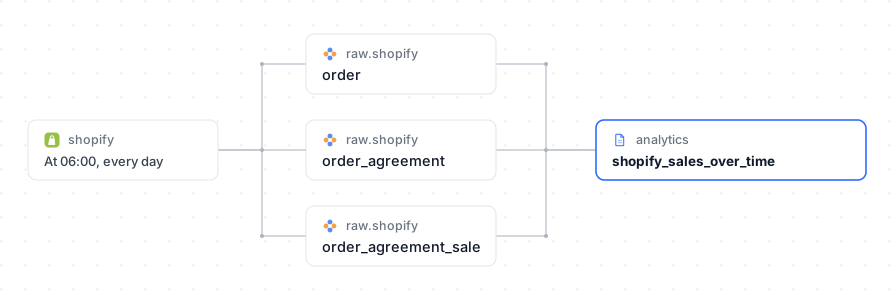
The Shopify connector lands the raw tables; a staging model wraps each one; shopify_sales_over_time reads all nine. Nine models sounds like a lot until you push the folder once and let Weld work out the dependency order.
What the full model adds
The excerpts above are the sales equation. The rest of the model exists because reconciling with Shopify's admin means handling the awkward cases:
| Why it's there | |
|---|---|
Parity variants — net_sales_shopify_parity, three quantity columns | Shopify's admin UI and its CSV export don't agree on units or on how order edits count. Rather than pick a winner, the model ships both and documents which is which. |
Returns detail — the reversal block, plus reversal_type | restock_type separates a cancellation (never shipped) from a genuine return (came back, restocked) from a refund with no restock. Return rate on all three together is noise. |
| Gift cards — four separate columns | Selling a gift card is deferred revenue, not product revenue. Shopify keeps it out of the sales equation, so the model tracks it alongside instead of inside. |
location_name and refund_location_name | Two different facts, so two columns. A POS sale carries a location; a refund of it processed through the web admin carries a different one, or none. Merging them into one column makes it impossible to ask either question. location_name is NULL when Shopify recorded no location — the model reports the absence rather than labelling it "Online", because "no physical location" is not the same claim. |
sales_channel — Shopify's value, not an interpretation | source_name verbatim: web for the online store, pos for retail, shopify_draft_order for manual orders, otherwise the handle of the app or marketplace that created the order. Split retail from online with this, or with location_name IS NOT NULL. |
country — a cascade, not a column | Shipping country is NULL for digital goods and POS, so it falls back to billing, then the location's country. |
fulfillment_status — with a digital-goods case | An order of only digital products never gets a status, which reads as "unfulfilled" in every dashboard and panics ops. |
Presentment money — plus shopify_fx_rate | Converting shop money at your own daily rate gives a number that doesn't match what the customer paid, because Shopify used its rate at checkout. The model derives Shopify's own implied rate per order. |
is_order_placed | Flags exactly one row per order on its first SALE day — the AOV denominator Shopify uses. At order grain you divide in your BI tool rather than hardcoding AOV into the model. |
Two things worth knowing before you run it. The timezone is read from
shop.iana_timezone, so there's nothing to hardcode. And the grain is
day × store × order × location × channel × row type — a day where an order both sells
and refunds produces two rows, which is what keeps the SALE and RETURN sides
independently auditable. Aggregate to day in your BI tool.
Step 3: Deploy the sales report model in Weld
Once the SQL is written, you have two options to get it running: paste it straight into a new Weld transform and publish, or (our recommended path) push the .sql file to a GitHub repo connected via Weld's GitHub Sync - every push deploys automatically, and only the models that changed re-materialise. Because the model is layered, GitHub Sync is the easier path here: push the folder and Weld works out the dependency order between the staging models and the report. If you're already running dbt, Weld's dbt Cloud integration orchestrates dbt jobs directly after each Shopify sync, so the model is just as at home in a dbt project as it is as a standalone Weld transform. Either way, the model reads directly from your synced Shopify streams, so once it's published the sales report keeps itself up to date on whatever schedule your Shopify sync runs on.
Step 4: Visualize your Shopify sales report
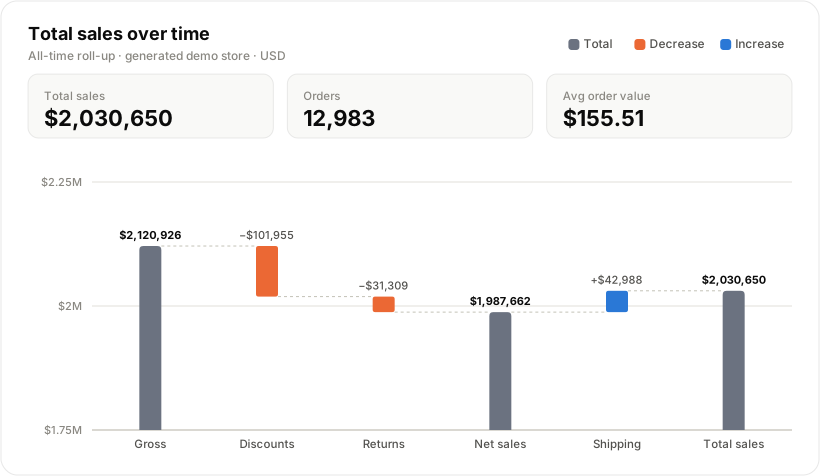
The all-time sales bridge: gross sales, less discounts and returns, gives net sales; shipping and taxes are then added to reach total sales. On this store the deductions are a thin sliver of gross - most of it survives all the way to total.
Point any BI tool (Looker Studio, Metabase, Power BI) at the published shopify_sales_over_time model, or hand the model to an AI agent and let it build the chart for you - the columns are already named and typed for a clean drag-and-drop.
Troubleshooting common issues when building a Shopify sales report
Work down this list in order - it's roughly the order of frequency.
- A small, consistent daily offset that cancels out over a month. Timezone. Something is truncating
happened_atto a date before converting it to store-local time. The model localises first, usingshop.iana_timezone- check that column is actually populated for your store. - Your numbers are consistently higher than Shopify's. Test orders aren't excluded — they're filtered in the
orderstaging model, ontest = TRUE. Resist the urge to also droppending: an authorised-but-uncaptured order (bank transfer, cash on delivery, manual payment) is a sale Shopify counts, so excluding it understates instead. Onlyvoidedis dropped in core, andcancelled_at IS NULLis applied in the analytics layer, where you can change it without core having already destroyed the rows. - Total sales looks too low. Don't exclude
refundedorpartially_refundedorders - they're real sales, and their refunds already arrive separately as RETURN events on the refund date. Filtering the order out removes the original sale from your totals while the refund was never double-counted in the first place, so you end up understating revenue. - Gross sales too high, net sales correct. Tax isn't being subtracted.
total_amount_shop_money_amounton an agreement sale line is tax-inclusive; every component excepttaxesis tax-exclusive. That's whatamount_ex_taxis for. - Returns land on the wrong days. You're attributing them to the order date instead of the refund date. On the event grain this is automatic - if it's happening, something upstream is joining back to the order's
created_at. - Units are off but revenue is right. Order-edit handling. Shopify's admin UI and its CSV export don't always agree on units, so pick which one you're reconciling against before you start debugging.
- Multi-currency totals don't match the payment processor. You're converting shop money at your own daily rate, but Shopify used its rate at checkout. The model already carries
presentment_net_sales- what the customer actually paid - plusshopify_fx_rate, Shopify's own implied rate per order. Use those rather than converting yourself, and cross-currency totals land much closer to settlement. - Inflated revenue on stores that sell gift cards. Gift card sales are deferred revenue, not product revenue. The query excludes them by filtering
line_type = 'PRODUCT'; if you want to report on them, sumline_type = 'GIFT_CARD'into separate columns rather than folding them into gross sales. - Digital-only orders look permanently unfulfilled. An order of only digital products never gets a fulfilment status, so every dashboard shows it as outstanding and ops chase it. The model reports those as
fulfillment_not_requiredinstead. - Your product report doesn't tie to your sales report. Almost always the non-product rows. Shipping, fees and gift cards belong to the order, not to any line, so a product-grain model has to carry them as rows with a NULL sku. Drop them and the product report sits below the sales report by exactly the value of shipping and fees.
- Every number inflates after adding a second storefront. Order IDs are only unique within a store, so a join missing
shopify_storefans rows out across brands. It fails silently — nothing errors, the totals just grow. - Margins show as 100%. A missing cost is being treated as zero. The model leaves
standard_costNULL where it doesn't know, so the gap is visible rather than flattering.
More Shopify report templates
The same four-step pattern - understand the logic, write the SQL, deploy in Weld, visualize - works for any other Shopify metric. Here are two more, plus the cost model that turns revenue into margin.
Product sales over time — the one that reconciles
What it is: the same sales equation as the report above, at line grain — day × store × order × line. This is the model merchandising lives in, and the one that makes SKU-level margin possible.
Replicates: Native - Shopify's "Total sales by product", but on the event grain so it actually ties to your sales report.
Getting a product report to reconcile is harder than it looks, and three things do the work:
| Why it matters | |
|---|---|
| Rows with a NULL sku | Shipping, duties, fees and gift cards belong to the order, not to any line. They have to be carried as sku-less rows — drop them and this model sits below the sales report by exactly the value of shipping and fees. |
| Two separate weights | Not every agreement says which line it belongs to, so order-level money is spread across lines. Units follow quantity share, money follows revenue share. One weight for both distorts mixed-price baskets. |
| Residual de-duplication | Returns arrive from both agreement RETURN events and order_line_refund rows — the same money, twice. The refund rows attribute per line; only the unexplained remainder gets spread. Sum both and returns double. |
It also carries COGS. Costs come from Shopify itself — inventory_item for the current cost and inventory_item__history for every change — so a January order is valued at January's cost rather than today's:
Show sku_cost_per_day — point-in-time cost per SKU
1-- shopify_sku_cost_per_day
2-- Point-in-time standard cost per SKU, for every day that SKU actually sold.
3--
4-- Costs change. Valuing a January order at today's cost overstates or understates
5-- margin for the whole of history, so this picks the cost that was in effect on
6-- the day of the sale: the most recent cost change at or before that day, falling
7-- back to the earliest known cost for orders that predate any recorded change.
8--
9-- Only (day, SKU) pairs that sold are produced, so this stays small rather than
10-- materialising a full SKU x calendar grid.
11--
12-- Depends on: staging.shopify.order, .order_line, .inventory_item
13  , --             .inventory_item__history, .shop
14with
15    shop as (
16        select
17            shopify_store
18          , coalesce(any_value(iana_timezone), 'UTC') as report_timezone
19        from
20            {{staging.shopify.shop}}
21        group by
22            shopify_store
23    )
24  , -- Every cost that has ever applied: the history table plus the current value.
25    cost_grid as (
26        select
27            shopify_store
28          , sku
29          , cost
30          , updated_at as effective_ts
31        from
32            {{staging.shopify.inventory_item__history}}
33        where
34            cost is not null
35        union all
36        select
37            shopify_store
38          , sku
39          , cost
40          , coalesce(updated_at, created_at) as effective_ts
41        from
42            {{staging.shopify.inventory_item}}
43        where
44            cost is not null
45    )
46  , -- Only the days each SKU actually sold.
47    day_skus as (
48        select distinct
49            date(datetime(o.processed_at, s.report_timezone)) as date
50          , ol.shopify_store
51          , ol.sku
52        from
53            {{staging.shopify.order_line}} ol
54            join {{staging.shopify.order}} o using (shopify_store, order_id)
55            join shop s using (shopify_store)
56        where
57            not ol.is_gift_card
58            and ol.sku is not null
59            and trim(ol.sku) != ''
60    )
61select
62    ds.date
63  , ds.shopify_store
64  , ds.sku
65  , cg.cost as standard_cost
66  , cg.effective_ts as cost_effective_at
67from
68    day_skus ds
69    left join cost_grid cg using (shopify_store, sku)
70    -- Prefer the newest cost effective on or before the sale day. The ELSE branch
71    -- keeps the earliest known cost for orders predating any recorded change, so old
72    -- orders get a cost rather than NULL.
73qualify
74    row_number() over (
75        partition by
76            ds.date
77          , ds.shopify_store
78          , ds.sku
79        order by
80            case
81                when cg.effective_ts < timestamp(date_add(ds.date, interval 1 day)) then 0
82                else 1
83            end
84          , cg.effective_ts desc
85    ) = 1
Note it leaves standard_cost NULL where it doesn't know, rather than zero. A zero cost reads as 100% margin and ends up in a board deck; a NULL shows up as the coverage gap it is.
Show the complete product model — all 491 lines (view in the repo)
1-- shopify_product_sales_over_time
2--
3-- The sales report at line grain: day x store x order x line. This is the model
4-- merchandising lives in, and the one that makes SKU-level margin possible.
5--
6-- It reconciles to sales_over_time. That is the whole point, and it is why the
7-- non-product rows are here: shipping, fees, gift cards and unattributable refund
8-- adjustments are emitted as rows with a NULL sku. Drop them and this model sits
9-- below the sales report by exactly the value of shipping and fees, and someone
10-- spends a week finding out why.
11--
12-- The hard part is attribution. An agreement records that money moved on an order
13 , -- not always which line it belongs to, so product money is distributed across the
14-- order's lines by weight - units follow quantity share, money follows revenue
15-- share. Using one weight for both distorts mixed-price baskets.
16--
17-- Returns arrive from two places: agreement RETURN events and order_line_refund
18-- rows. Same money, two sources. Naively unioning both doubles returns, so the
19-- refund rows attribute per line and only the unexplained residual is spread.
20--
21-- Depends on: staging.shopify.{order, order_line, order_agreement
22 , -- order_agreement_sale, order_refund, order_line_refund, location
23 , -- shop} and core.shopify.sku_cost_per_day
24with
25 shop as (
26 select
27 shopify_store
28 , any_value(currency) as shop_currency
29 , coalesce(any_value(iana_timezone), 'UTC') as report_timezone
30 from
31 {{staging.shopify.shop}}
32 group by
33 shopify_store
34 )
35 , locations as (
36 select
37 shopify_store
38 , location_id
39 , location_name
40 , location_country_code
41 from
42 {{staging.shopify.location}}
43 )
44 , orders as (
45 select
46 o.shopify_store
47 , o.order_id
48 , o.order_name
49 , o.location_id
50 , o.source_name
51 , o.financial_status
52 , o.cancelled_at
53 , date(datetime(o.processed_at, s.report_timezone)) as order_created_day
54 , -- No presentment-currency fallback and no default code: presentment is
55 -- the buyer's currency, and a guessed code mislabels every amount.
56 coalesce(
57 o.order_shop_currency
58 , o.currency
59 , s.shop_currency
60 ) as shop_currency
61 , -- Shipping country is the right geography but is NULL for digital goods
62 -- and POS, so cascade to billing, then the location's country.
63 coalesce(
64 o.shipping_country_code
65 , o.billing_country_code
66 , l.location_country_code
67 ) as country
68 , -- The order's own location, straight from Shopify, NULL when there is
69 -- none. Identical expression in sales_over_time so the two models
70 -- reconcile on this dimension - they previously disagreed, which meant
71 -- a per-location comparison between them could never tie.
72 l.location_name as location_name
73 from
74 {{staging.shopify.order}} o
75 join shop s using (shopify_store)
76 left join locations l using (shopify_store, location_id)
77 -- Voided only - see sales_over_time. Keeping 'pending' matters for parity:
78 -- if the two models filter orders differently they cannot reconcile.
79 where
80 o.financial_status != 'voided'
81 )
82 , -- Untitled lines are dropped by Shopify's product reports: deleted products
83 , -- draft-order custom lines, API artifacts.
84 order_lines as (
85 select
86 shopify_store
87 , order_id
88 , line_id
89 , product_id
90 , variant_id
91 , product_title
92 , variant_title
93 , sku
94 , vendor
95 , cast(quantity as numeric) as ordered_quantity
96 , unit_price
97 , discounts as line_discount
98 , gross_sales as line_gross_sales
99 , gross_sales - discounts as line_net_sales
100 from
101 {{staging.shopify.order_line}}
102 where
103 not is_gift_card
104 and product_title is not null
105 )
106 , -- Two weights, deliberately: money follows revenue share, units follow quantity
107 -- share. The ELSE branch splits evenly for fully discounted orders, where every
108 -- line is zero and a share would be undefined.
109 line_weights as (
110 select
111 ol.*
112 , case
113 when sum(greatest(ol.ordered_quantity, 0)) over (
114 partition by
115 ol.shopify_store
116 , ol.order_id
117 ) > 0 then safe_divide(
118 greatest(ol.ordered_quantity, 0)
119 , sum(greatest(ol.ordered_quantity, 0)) over (
120 partition by
121 ol.shopify_store
122 , ol.order_id
123 )
124 )
125 else safe_divide(
126 1
127 , count(*) over (
128 partition by
129 ol.shopify_store
130 , ol.order_id
131 )
132 )
133 end as quantity_weight
134 , case
135 when sum(greatest(ol.line_net_sales, 0)) over (
136 partition by
137 ol.shopify_store
138 , ol.order_id
139 ) > 0 then safe_divide(
140 greatest(ol.line_net_sales, 0)
141 , sum(greatest(ol.line_net_sales, 0)) over (
142 partition by
143 ol.shopify_store
144 , ol.order_id
145 )
146 )
147 else safe_divide(
148 1
149 , count(*) over (
150 partition by
151 ol.shopify_store
152 , ol.order_id
153 )
154 )
155 end as revenue_weight
156 from
157 order_lines ol
158 )
159 , agreements as (
160 select
161 shopify_store
162 , order_agreement_id
163 , order_id
164 , happened_at
165 , reason
166 from
167 {{staging.shopify.order_agreement}}
168 )
169 , sales as (
170 select
171 shopify_store
172 , order_agreement_id
173 , order_id
174 , line_type
175 , action_type
176 , cast(quantity as numeric) as quantity
177 , total_tax
178 , discount_before_tax
179 , amount_ex_tax
180 from
181 {{staging.shopify.order_agreement_sale}}
182 )
183 , events as (
184 select
185 date(datetime(a.happened_at, s.report_timezone)) as date
186 , a.shopify_store
187 , a.order_id
188 , a.reason
189 , sa.line_type
190 , sa.action_type
191 , sa.quantity
192 , sa.total_tax
193 , sa.discount_before_tax
194 , sa.amount_ex_tax
195 from
196 agreements a
197 join shop s using (shopify_store)
198 join sales sa using (shopify_store, order_agreement_id, order_id)
199 )
200 , -- ---------------------------------------------------------------- product sales
201 sale_order_day as (
202 select
203 date
204 , shopify_store
205 , order_id
206 , sum(quantity) as sale_quantity
207 , sum(
208 case
209 when action_type = 'ORDER'
210 and reason not in ('RETURN', 'ORDER_EDIT') then quantity
211 else 0
212 end
213 ) as quantity_ordered_shopify_compat
214 , sum(
215 case
216 when action_type = 'ORDER'
217 and reason != 'RETURN' then quantity
218 else 0
219 end
220 ) as quantity_ordered_shopify_export_parity
221 , sum(amount_ex_tax) as net_sales
222 , (-1) * sum(greatest(discount_before_tax, 0)) as discounts
223 , sum(total_tax) as taxes
224 from
225 events
226 where
227 line_type = 'PRODUCT'
228 and action_type in ('ORDER', 'UPDATE')
229 group by
230 1
231 , 2
232 , 3
233 )
234 , sale_line_events as (
235 select
236 d.date
237 , o.shopify_store
238 , o.order_id
239 , o.order_name
240 , o.financial_status
241 , o.cancelled_at
242 , o.location_id
243 , o.source_name
244 , o.shop_currency
245 , o.country
246 , o.location_name
247 , 'SALE' as report_row_type
248 , lw.line_id
249 , lw.product_id
250 , lw.variant_id
251 , lw.product_title
252 , lw.variant_title
253 , lw.sku
254 , lw.vendor
255 , lw.unit_price
256 , d.sale_quantity * lw.quantity_weight as quantity
257 , d.quantity_ordered_shopify_compat * lw.quantity_weight as quantity_ordered_shopify_compat
258 , d.quantity_ordered_shopify_export_parity * lw.quantity_weight as quantity_ordered_shopify_export_parity
259 , -- Fractional on purpose: each line carries its share of one order, so the
260 -- lines still sum to exactly 1.0 per order-day and the two reports tie.
261 case
262 when d.date = o.order_created_day then lw.revenue_weight
263 else 0
264 end as orders
265 , (d.net_sales - d.discounts) * lw.revenue_weight as gross_sales
266 , d.discounts * lw.revenue_weight as discounts
267 , cast(0 as numeric) as returns
268 , d.net_sales * lw.revenue_weight as net_sales
269 , cast(0 as numeric) as shipping_charges
270 , cast(0 as numeric) as duties
271 , cast(0 as numeric) as additional_fees
272 , cast(0 as numeric) as return_fees
273 , d.taxes * lw.revenue_weight as taxes
274 , cast(0 as numeric) as sales_reversals
275 , cast(0 as numeric) as discount_reversals
276 , cast(0 as numeric) as tax_reversals
277 , cast(0 as numeric) as shipping_reversals
278 , cast(0 as numeric) as reversed_quantity
279 , cast(0 as numeric) as gift_card_gross_sales
280 , cast(0 as numeric) as gift_card_net_sales
281 , cast(0 as numeric) as gift_card_discounts
282 , cast(0 as numeric) as gift_card_taxes
283 from
284 line_weights lw
285 join sale_order_day d using (shopify_store, order_id)
286 join orders o using (shopify_store, order_id)
287 )
288 , -- ---------------------------------------------------------------------- returns
289 refunds as (
290 select
291 r.shopify_store
292 , r.refund_id
293 , r.order_id
294 , date(datetime(r.refund_created_at, s.report_timezone)) as date
295 from
296 {{staging.shopify.order_refund}} r
297 join shop s using (shopify_store)
298 )
299 , -- What the agreements say the return was worth, per order-day.
300 return_order_day as (
301 select
302 date
303 , shopify_store
304 , order_id
305 , sum(quantity) as return_quantity
306 , sum(amount_ex_tax) as return_net_sales
307 , (-1) * sum(discount_before_tax) as return_discount_reversals
308 , sum(total_tax) as return_taxes
309 from
310 events
311 where
312 action_type = 'RETURN'
313 and line_type in ('PRODUCT', 'ADJUSTMENT')
314 group by
315 1
316 , 2
317 , 3
318 )
319 , -- What the per-line refund rows already account for.
320 refund_line_totals as (
321 select
322 r.date
323 , r.shopify_store
324 , r.order_id
325 , olr.order_line_id as line_id
326 , sum(cast(olr.quantity as numeric)) as refund_quantity
327 from
328 {{staging.shopify.order_line_refund}} olr
329 join refunds r using (shopify_store, refund_id)
330 group by
331 1
332 , 2
333 , 3
334 , 4
335 )
336 , refund_order_day as (
337 select
338 date
339 , shopify_store
340 , order_id
341 , sum(refund_quantity) as refund_quantity
342 from
343 refund_line_totals
344 group by
345 1
346 , 2
347 , 3
348 )
349 , -- Returns land per line where the refund rows say so.
350 return_line_events as (
351 select
352 rlt.date
353 , o.shopify_store
354 , o.order_id
355 , o.order_name
356 , o.financial_status
357 , o.cancelled_at
358 , o.location_id
359 , o.source_name
360 , o.shop_currency
361 , o.country
362 , o.location_name
363 , 'RETURN' as report_row_type
364 , lw.line_id
365 , lw.product_id
366 , lw.variant_id
367 , lw.product_title
368 , lw.variant_title
369 , lw.sku
370 , lw.vendor
371 , lw.unit_price
372 , (-1) * rlt.refund_quantity as quantity
373 , cast(0 as numeric) as quantity_ordered_shopify_compat
374 , cast(0 as numeric) as quantity_ordered_shopify_export_parity
375 , cast(0 as numeric) as orders
376 , cast(0 as numeric) as gross_sales
377 , cast(0 as numeric) as discounts
378 , (-1) * rlt.refund_quantity * lw.unit_price as returns
379 , (-1) * rlt.refund_quantity * lw.unit_price as net_sales
380 , cast(0 as numeric) as shipping_charges
381 , cast(0 as numeric) as duties
382 , cast(0 as numeric) as additional_fees
383 , cast(0 as numeric) as return_fees
384 , cast(0 as numeric) as taxes
385 , (-1) * rlt.refund_quantity * lw.unit_price as sales_reversals
386 , cast(0 as numeric) as discount_reversals
387 , cast(0 as numeric) as tax_reversals
388 , cast(0 as numeric) as shipping_reversals
389 , (-1) * rlt.refund_quantity as reversed_quantity
390 , cast(0 as numeric) as gift_card_gross_sales
391 , cast(0 as numeric) as gift_card_net_sales
392 , cast(0 as numeric) as gift_card_discounts
393 , cast(0 as numeric) as gift_card_taxes
394 from
395 refund_line_totals rlt
396 join line_weights lw using (shopify_store, order_id, line_id)
397 join orders o using (shopify_store, order_id)
398 )
399 , -- Whatever the agreements say was returned but the refund rows did not explain -
400 -- partial refunds, goodwill credits - spread across the order's lines. Without
401 -- this the two reports disagree; with it counted twice, returns double.
402 return_residual as (
403 select
404 rod.date
405 , rod.shopify_store
406 , rod.order_id
407 , rod.return_quantity + coalesce(rfd.refund_quantity, 0) as residual_quantity
408 , rod.return_net_sales
409 , rod.return_discount_reversals
410 , rod.return_taxes
411 from
412 return_order_day rod
413 left join refund_order_day rfd using (date, shopify_store, order_id)
414 )
415 , return_adjustment_events as (
416 select
417 rr.date
418 , o.shopify_store
419 , o.order_id
420 , o.order_name
421 , o.financial_status
422 , o.cancelled_at
423 , o.location_id
424 , o.source_name
425 , o.shop_currency
426 , o.country
427 , o.location_name
428 , 'RETURN' as report_row_type
429 , cast(null as int64) as line_id
430 , cast(null as int64) as product_id
431 , cast(null as int64) as variant_id
432 , cast(null as string) as product_title
433 , cast(null as string) as variant_title
434 , cast(null as string) as sku
435 , cast(null as string) as vendor
436 , cast(null as numeric) as unit_price
437 , rr.residual_quantity as quantity
438 , cast(0 as numeric) as quantity_ordered_shopify_compat
439 , cast(0 as numeric) as quantity_ordered_shopify_export_parity
440 , cast(0 as numeric) as orders
441 , cast(0 as numeric) as gross_sales
442 , cast(0 as numeric) as discounts
443 , rr.return_net_sales as returns
444 , rr.return_net_sales as net_sales
445 , cast(0 as numeric) as shipping_charges
446 , cast(0 as numeric) as duties
447 , cast(0 as numeric) as additional_fees
448 , cast(0 as numeric) as return_fees
449 , rr.return_taxes as taxes
450 , rr.return_net_sales as sales_reversals
451 , rr.return_discount_reversals as discount_reversals
452 , rr.return_taxes as tax_reversals
453 , cast(0 as numeric) as shipping_reversals
454 , rr.residual_quantity as reversed_quantity
455 , cast(0 as numeric) as gift_card_gross_sales
456 , cast(0 as numeric) as gift_card_net_sales
457 , cast(0 as numeric) as gift_card_discounts
458 , cast(0 as numeric) as gift_card_taxes
459 from
460 return_residual rr
461 join orders o using (shopify_store, order_id)
462 -- Floating-point residue would otherwise produce thousands of near-zero rows.
463 where
464 abs(rr.return_net_sales) > 0.0001
465 or abs(rr.return_discount_reversals) > 0.0001
466 or abs(rr.residual_quantity) > 0.0001
467 )
468 , -- ------------------------------------------------- non-product money, NULL sku
469 -- These belong to the order, not to any line. Shopify's own product exports show
470 -- them with an empty product column, and they are what makes this model tie out
471 -- against sales_over_time.
472 non_product_day as (
473 select
474 date
475 , shopify_store
476 , order_id
477 , sum(
478 case
479 when line_type = 'SHIPPING' then amount_ex_tax
480 else 0
481 end
482 ) as shipping_charges
483 , sum(
484 case
485 when line_type = 'SHIPPING'
486 and action_type = 'RETURN' then amount_ex_tax
487 else 0
488 end
489 ) as shipping_reversals
490 , sum(
491 case
492 when line_type = 'DUTY' then amount_ex_tax
493 else 0
494 end
495 ) as duties
496 , sum(
497 case
498 when line_type = 'FEE' then amount_ex_tax
499 else 0
500 end
501 ) as return_fees
502 , sum(
503 case
504 when line_type in ('SHIPPING', 'DUTY', 'FEE') then total_tax
505 else 0
506 end
507 ) as taxes
508 , sum(
509 case
510 when line_type = 'GIFT_CARD' then amount_ex_tax + greatest(discount_before_tax, 0)
511 else 0
512 end
513 ) as gift_card_gross_sales
514 , sum(
515 case
516 when line_type = 'GIFT_CARD' then amount_ex_tax
517 else 0
518 end
519 ) as gift_card_net_sales
520 , (-1) * sum(
521 case
522 when line_type = 'GIFT_CARD' then greatest(discount_before_tax, 0)
523 else 0
524 end
525 ) as gift_card_discounts
526 , sum(
527 case
528 when line_type = 'GIFT_CARD' then total_tax
529 else 0
530 end
531 ) as gift_card_taxes
532 from
533 events
534 where
535 line_type in ('SHIPPING', 'DUTY', 'FEE', 'GIFT_CARD')
536 group by
537 1
538 , 2
539 , 3
540 )
541 , non_product_line_events as (
542 select
543 d.date
544 , o.shopify_store
545 , o.order_id
546 , o.order_name
547 , o.financial_status
548 , o.cancelled_at
549 , o.location_id
550 , o.source_name
551 , o.shop_currency
552 , o.country
553 , o.location_name
554 , 'SALE' as report_row_type
555 , cast(null as int64) as line_id
556 , cast(null as int64) as product_id
557 , cast(null as int64) as variant_id
558 , cast(null as string) as product_title
559 , cast(null as string) as variant_title
560 , cast(null as string) as sku
561 , cast(null as string) as vendor
562 , cast(null as numeric) as unit_price
563 , cast(0 as numeric) as quantity
564 , cast(0 as numeric) as quantity_ordered_shopify_compat
565 , cast(0 as numeric) as quantity_ordered_shopify_export_parity
566 , cast(0 as numeric) as orders
567 , cast(0 as numeric) as gross_sales
568 , cast(0 as numeric) as discounts
569 , cast(0 as numeric) as returns
570 , cast(0 as numeric) as net_sales
571 , d.shipping_charges as shipping_charges
572 , d.duties as duties
573 , cast(0 as numeric) as additional_fees
574 , d.return_fees as return_fees
575 , d.taxes as taxes
576 , cast(0 as numeric) as sales_reversals
577 , cast(0 as numeric) as discount_reversals
578 , cast(0 as numeric) as tax_reversals
579 , d.shipping_reversals as shipping_reversals
580 , cast(0 as numeric) as reversed_quantity
581 , d.gift_card_gross_sales
582 , d.gift_card_net_sales
583 , d.gift_card_discounts
584 , d.gift_card_taxes
585 from
586 non_product_day d
587 join orders o using (shopify_store, order_id)
588 )
589 , -- UNION ALL matches positionally, not by name: every branch must emit the same
590 -- columns in the same order. Verbose, but adding an event type is copy-paste
591 -- plus one union line.
592 line_events as (
593 select
594 *
595 from
596 sale_line_events
597 union all
598 select
599 *
600 from
601 return_line_events
602 union all
603 select
604 *
605 from
606 return_adjustment_events
607 union all
608 select
609 *
610 from
611 non_product_line_events
612 )
613 , final_base as (
614 select
615 date
616 , shopify_store
617 , order_id
618 , order_name
619 , financial_status
620 , cancelled_at
621 , location_id
622 , source_name
623 , shop_currency
624 , country
625 , location_name
626 , report_row_type
627 , line_id
628 , product_id
629 , variant_id
630 , product_title
631 , variant_title
632 , sku
633 , vendor
634 , max(unit_price) as unit_price
635 , sum(quantity) as quantity
636 , sum(quantity_ordered_shopify_compat) as quantity_ordered_shopify_compat
637 , sum(quantity_ordered_shopify_export_parity) as quantity_ordered_shopify_export_parity
638 , sum(orders) as orders
639 , sum(gross_sales) as gross_sales
640 , sum(discounts) as discounts
641 , sum(returns) as returns
642 , sum(net_sales) as net_sales
643 , sum(shipping_charges) as shipping_charges
644 , sum(duties) as duties
645 , sum(additional_fees) as additional_fees
646 , sum(return_fees) as return_fees
647 , sum(taxes) as taxes
648 , sum(sales_reversals) as sales_reversals
649 , sum(discount_reversals) as discount_reversals
650 , sum(tax_reversals) as tax_reversals
651 , sum(shipping_reversals) as shipping_reversals
652 , sum(reversed_quantity) as reversed_quantity
653 , sum(gift_card_gross_sales) as gift_card_gross_sales
654 , sum(gift_card_net_sales) as gift_card_net_sales
655 , sum(gift_card_discounts) as gift_card_discounts
656 , sum(gift_card_taxes) as gift_card_taxes
657 from
658 line_events
659 group by
660 1
661 , 2
662 , 3
663 , 4
664 , 5
665 , 6
666 , 7
667 , 8
668 , 9
669 , 10
670 , 11
671 , 12
672 , 13
673 , 14
674 , 15
675 , 16
676 , 17
677 , 18
678 , 19
679 )
680select
681 fb.date
682 , fb.shopify_store
683 , fb.order_id
684 , fb.order_name
685 , fb.report_row_type
686 , fb.financial_status
687 , fb.cancelled_at is not null as is_cancelled
688 , fb.location_name
689 , fb.country
690 , fb.source_name
691 , lower(fb.source_name) as sales_channel
692 , fb.shop_currency
693 , fb.line_id
694 , fb.product_id
695 , fb.variant_id
696 , fb.product_title
697 , fb.variant_title
698 , fb.sku
699 , fb.vendor
700 , fb.unit_price
701 , fb.orders
702 , fb.quantity
703 , fb.quantity_ordered_shopify_compat
704 , fb.quantity_ordered_shopify_export_parity
705 , round(fb.gross_sales, 2) as gross_sales
706 , round(fb.discounts, 2) as discounts
707 , round(fb.returns, 2) as returns
708 , round(fb.net_sales, 2) as net_sales
709 , round(fb.shipping_charges, 2) as shipping_charges
710 , round(fb.duties, 2) as duties
711 , round(fb.additional_fees, 2) as additional_fees
712 , round(fb.return_fees, 2) as return_fees
713 , round(fb.taxes, 2) as taxes
714 , round(
715 fb.net_sales + fb.shipping_charges + fb.duties + fb.return_fees + fb.additional_fees + fb.taxes
716 , 2
717 ) as total_shopify_sales
718 , round(
719 fb.net_sales + fb.shipping_charges + fb.return_fees + fb.additional_fees
720 , 2
721 ) as total_sales
722 , round(fb.sales_reversals, 2) as net_sales_reversals
723 , round(fb.sales_reversals - fb.discount_reversals, 2) as gross_sales_reversals
724 , round(
725 fb.sales_reversals + fb.tax_reversals + fb.shipping_reversals + fb.return_fees
726 , 2
727 ) as total_sales_reversals
728 , round(fb.discount_reversals, 2) as discount_reversals
729 , round(fb.tax_reversals, 2) as tax_reversals
730 , round(fb.shipping_reversals, 2) as shipping_reversals
731 , fb.reversed_quantity
732 , round(fb.gift_card_gross_sales, 2) as gift_card_gross_sales
733 , round(fb.gift_card_net_sales, 2) as gift_card_net_sales
734 , round(fb.gift_card_discounts, 2) as gift_card_discounts
735 , round(fb.gift_card_taxes, 2) as gift_card_taxes
736 , round(fb.taxes - fb.gift_card_taxes, 2) as taxes_excluding_gift_cards
737 , -- Point-in-time cost, so a January order is valued at January's cost. NULL
738 -- rather than 0 where cost is unknown: a zero cost reads as 100% margin and
739 -- ends up in a board deck, a NULL shows up as the coverage gap it is.
740 scd.standard_cost
741 , round(fb.quantity * scd.standard_cost, 2) as cogs
742 , round(
743 fb.net_sales - (fb.quantity * scd.standard_cost)
744 , 2
745 ) as gross_profit
746from
747 final_base fb
748 left join {{core.shopify.sku_cost_per_day}} scd using (date, shopify_store, sku)
749order by
750 fb.date
751 , fb.shopify_store
752 , fb.order_id
753 , fb.line_idIf you take one thing from this model, take the reconciliation test that ships with it: sum the product level by day and diff it against the order level. If it returns rows, start with the NULL-sku rows.
Sales by product — the quick ranking one
What it is: units and revenue for every product, variant and SKU, per day - so you can rank top sellers and break the numbers down by product type or vendor.
Replicates: Native - Shopify's "Total sales by product".
Scope, stated honestly: unlike the sales report above, this one reads
order_lineon the order date. That's the right trade-off for ranking top sellers -order_lineis where product identity lives, and relative ranking barely moves whether or not you net out returns. It is not the right basis for SKU-level revenue that has to tie to your sales report, because returns stay attached to the original order date and never reduce the SKU that was actually sent back. If you need product-level numbers that reconcile to the day, use product sales over time above instead - that's exactly what it's for.
The SQL (view in the repo):
1-- shopify_sales_by_product - recreates Shopify's "Total sales by product"
2-- Grain: product x variant (SKU) x day, on the ORDER date. Currency: shop money.
3-- Depends on: staging.shopify.order, .order_line, .product
4--
5-- SCOPE: net of discounts, NOT net of returns. Does not reconcile to
6-- shopify_sales_over_time - returns stay on the original order date. Right for
7-- ranking top sellers, wrong for SKU revenue that has to tie out.
8with
9    orders as (
10        select
11            shopify_store
12          , order_id
13          , date(processed_at) as date
14        from
15            {{staging.shopify.order}}
16    )
17select
18    o.date
19  , l.shopify_store
20  , l.product_id
21  , -- Canonical product attributes beat the order_line snapshot, which was taken
22    -- at purchase time and goes stale if a product is renamed.
23    coalesce(p.product_title, l.product_title) as product_title
24  , p.product_type
25  , coalesce(p.vendor, l.vendor) as vendor
26  , l.variant_id
27  , l.variant_title
28  , l.sku
29  , sum(l.quantity) as units
30  , count(distinct o.order_id) as orders
31  , round(sum(l.gross_sales), 2) as gross_sales
32  , round(sum(l.discounts), 2) as discounts
33  , round(sum(l.gross_sales - l.discounts), 2) as net_sales
34from
35    {{staging.shopify.order_line}} l
36    -- shopify_store in every join key: order IDs are only unique within a store.
37    join orders o using (shopify_store, order_id)
38    left join {{staging.shopify.product}} p using (shopify_store, product_id)
39    -- Gift cards are deferred revenue, not product revenue. staging.shopify.order_line
40    -- keeps them, so exclude them here.
41where
42    not l.is_gift_card
43    -- Ordinals, not names: product_title and vendor exist on both joined tables, so
44    -- a bare column name here would be ambiguous.
45group by
46    1
47  , 2
48  , 3
49  , 4
50  , 5
51  , 6
52  , 7
53  , 8
54  , 9
55order by
56    o.date
57  , net_sales desc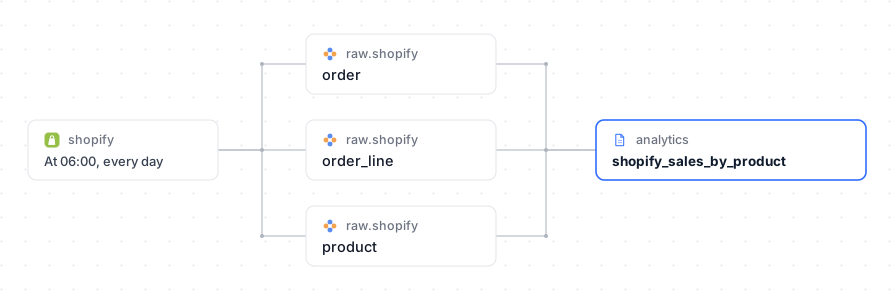
sales_by_product reads the same staging models as the sales report, joining orders to lines and product to roll revenue up to product, variant and SKU per day.
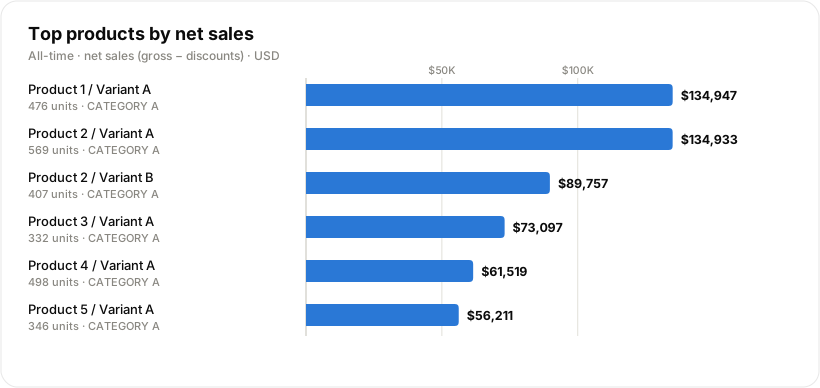
Net sales for the top product variants, with units alongside each. Note the top two are near-identical on revenue but 93 units apart - the same model lets you re-rank by units, product type or vendor to see that.
How we built this (AI-native Weld: MCP + GitHub Sync workflow)
The interesting part isn't just the SQL - it's how fast and low-friction it was to build and ship. This is the workflow Weld is built for, and it's one you can copy today.
A local repo, push to deploy. These models are just .sql files in a local Git repo. You write them in your own IDE, git push, and GitHub Sync deploys them to Weld. No copy-pasting into a web editor, full version control and review on every change, and only the models that actually changed re-materialise. Idea to live model in minutes.
AI removes the SQL friction. You don't have to be a SQL expert. An AI agent, working through the Weld MCP, inspects your real synced data, writes each model, and validates it against the live warehouse before anything ships. It catches the gotchas a beginner would miss - localising timestamps before truncating them to a date, keeping refunded orders as real sales, subtracting tax out of agreement amounts - so the agent does the heavy lifting and you just review the diff and push.
Put together, local repo plus GitHub plus AI is the whole point: the AI writes the SQL, Git ships it, Weld runs it, and a beginner moves at an expert's pace. For the deeper walkthroughs:
Make it yours
Here's the short path from this post to your own live dashboards:
- Grab the templates from the Shopify template library, where all three models and their staging dependencies are ready to copy, or from the public repo that is the source of truth for both.
- Get them into Weld. Connect the repo with GitHub Sync (push to deploy), or paste each model into a new Weld transform.
- Point them at your data. The models already read your raw Shopify tables (
raw.shopify.*), so once your Shopify streams are synced they run exactly as they are - no rewriting required. Each model's header lists the tables it reads, so you can check the fit at a glance. - Visualise. Point your BI tool at the published models, or hand a model to an AI agent and let it build the dashboard for you.
FAQ: building a Shopify sales report with SQL
How do I calculate total sales in Shopify using SQL?
Total sales is gross sales (price × quantity) minus discounts minus sales reversals, plus shipping, duties, fees and taxes. The Step 2 query above builds that bridge day by day from the raw order, order_agreement and order_agreement_sale tables, attributing every component to the day it actually happened.
Should I use order_line or order_agreement_sale for a Shopify sales report?
order_agreement_sale, for anything time-based. order_line is a current-state table: it describes what an order looks like right now and cannot express when its value changed, so returns, edits and cancellations can't be attributed to the day they happened. Use order_line only for product identity - SKU, title, variant, vendor. Summing order_line is the most common reason a hand-built sales report drifts from Shopify's admin.
Does Shopify's average order value include refunds and shipping?
No. Shopify calculates AOV as gross sales minus discounts, divided by orders - before any post-order adjustments like returns, shipping or taxes. Dividing total_sales by orders instead is a common mistake that lets refunds and shipping distort the number.
What Shopify data do I need synced to build a sales report?
At minimum: order, order_agreement and order_agreement_sale. The full sales report also uses order_line, order_refund, order_line_refund, shop and location. Product-level margin adds inventory_item plus its history table, and the quick ranking template uses product. Sync them all in one go with the Shopify connector.
Can I build this Shopify sales report in Snowflake or Redshift instead of BigQuery?
Yes. The query is written in BigQuery SQL, but the logic - CTEs, joins, and aggregations - is standard ANSI SQL and ports to Snowflake or Redshift with only minor syntax changes (e.g. SAFE_DIVIDE → NULLIF-based division).
Will this sales report match the numbers in my Shopify dashboard?
It's built to reproduce Shopify's own "Total sales over time" logic on the same event grain Shopify uses, so a single-store setup should land within a fraction of a percent. Exact-to-the-cent parity across all history isn't a realistic goal - Shopify restates some historical figures and rounds in places you can't observe - so agree a tolerance with finance rather than chasing zero. If you're further out than that, work through the troubleshooting section above, starting with timezone.
How do I build this across multiple Shopify stores?
The models are already multi-store safe. Order IDs are only unique within a store, so shopify_store is carried through every join key, window partition and GROUP BY - without it, rows silently fan out across brands. Each staging model labels its rows with the store it came from, so adding a storefront means adding a UNION ALL block in staging and nothing else; core and analytics need no changes. Where it gets harder is schema drift between stores that were set up years apart, which is what the dbt version of this guide covers.
How often does the sales report update?
As often as your Shopify sync runs. Since the model reads directly from your synced raw tables, republishing isn't needed - it recalculates from whatever data is currently in your warehouse each time it runs.
Do I need dbt to build this Shopify sales report?
No - the SQL above runs standalone as a Weld transform. dbt is worth adding once you want version-controlled tests, documentation and lineage across many models rather than just this one; Weld's dbt Cloud integration orchestrates dbt jobs directly after each Shopify sync if you go that route. If you're already in dbt, the dbt version of this build covers the staging layer, multi-store unions, multi-currency and the test suite.
Conclusion
You now own your Shopify sales report instead of renting it from Shopify's dashboard - and that's just the start. Because the model lives in your warehouse, you can join it to everything else Weld connects to (your ad platforms, your accounting and ERP data, your subscription and support tools), and use the same four-step pattern to rebuild any other Shopify report you rely on - turning today's report into the foundation your whole analytics stack builds on.
Related reading
- Build the same report as a production dbt model →
- Why Shopify's reports don't match your data warehouse →
- Shopify's official sales report documentation →
- BigQuery vs. Snowflake →
- Top 15 Best ETL Tools in 2026 →
- How to build a modern data stack →
- BigQuery partitioning and clustering →
- How to calculate MRR with Stripe using SQL →