
Why build your own Amazon reports?
Summary: Amazon Seller Central gives you Business Reports you cannot redefine and a settlement report nobody reads — and Amazon Vendor Central is a completely different data model that reuses the word "revenue" for two different things. This guide is the production blueprint for rebuilding all of it in your warehouse: the three revenue numbers and why they never match, the four data traps that silently multiply your numbers, the event grain that stops last month's revenue changing, the settlement ledger that shows what Amazon actually paid, and the vendor scorecard your Vendor Manager is quoting at you. Every example is BigQuery, and every model is free to copy in both Weld and dbt form.
You need your own models the moment you have to do any of these:
- Work out what an ASIN is actually worth after referral fees, FBA fees, returns and COGS
- Report Seller Central and Vendor Central as one business
- Report across several marketplaces in a single currency
- Keep history beyond Amazon's retention — 89 days for settlements, 29 for vendor real-time
- Put Amazon next to your ad spend, your ERP and your other channels in one BI layer
And the honest reason most teams start: someone asked why three dashboards show three different Amazon revenue figures, and all three turned out to be right.
Should you just install a package instead? If you are on Fivetran and only need orders and inventory, quite possibly — see what already exists before writing anything. The short version: the maintained packages stop before fees, before the Business Reports, and before Vendor Central entirely.
Part 1 — Amazon's three revenue numbers
Amazon will answer "what did we sell" three different ways, and for a single month they will give you three different figures. This is not a data quality problem. They are three different questions, and almost every reporting argument on Amazon is two people quoting different ones at each other.
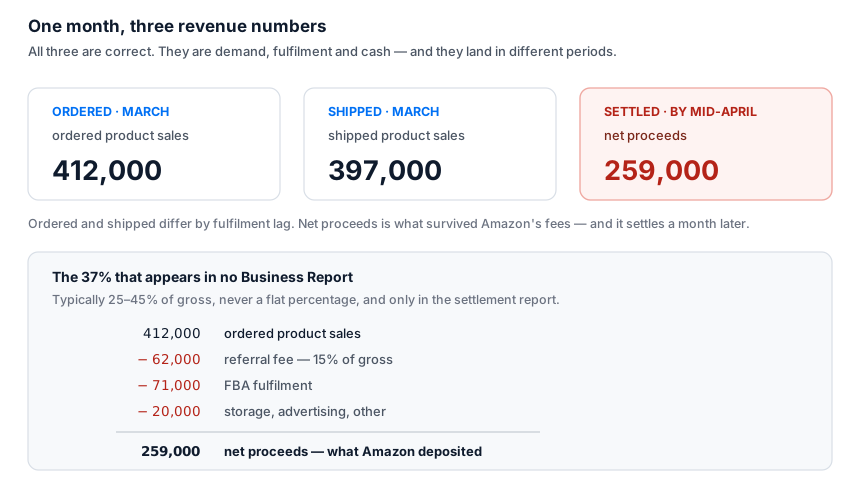
| What it is | Dated by | Where it lives | |
|---|---|---|---|
| Ordered product sales | What customers ordered. The Seller Central headline. | order date | sales_and_traffic_report_by_date |
| Shipped product sales | What actually left the warehouse. | ship date | the same report |
| Net proceeds | What Amazon paid you, after every fee. | settlement date | settlement_report |
Demand, fulfilment, and cash. The gap between the first and the third is typically 25–45% of gross, it is not a flat percentage, and it appears in no Business Report. That is the whole reason to build this.
Which one goes in the board deck? Ordered product sales, because that is what Seller Central's dashboard shows and what everyone already quotes. Just put net proceeds next to it. The moment all three are on one row, the argument stops being about which number is real and starts being about the gap — which is the useful conversation.
Part 2 — Four Seller Central data traps that multiply your numbers
Before any modelling, these four. Each one produces plausible-looking numbers that are wrong, which is what makes them expensive: nothing errors, nothing looks odd, and the report gets published.
Trap 1: the same day is synced several times
Amazon re-generates its Business Reports on every sync, and restates the trailing ~72 hours as cancellations and returns settle. Your ELT tool appends each generation, so one date legitimately appears several times with different numbers.
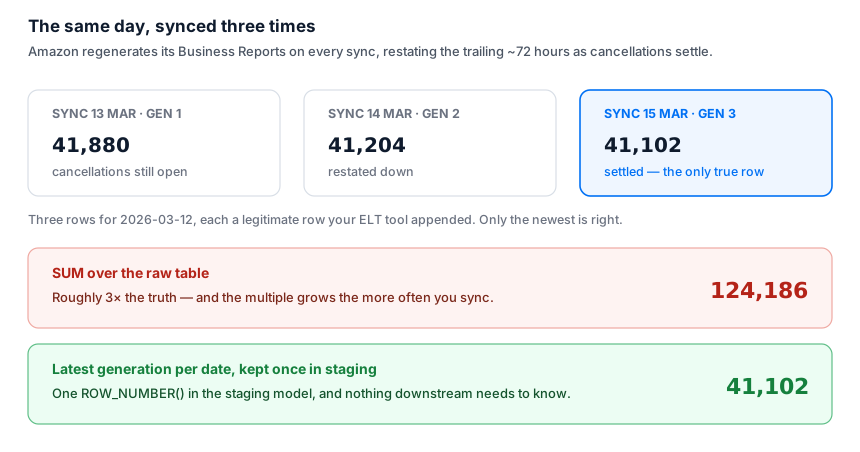
SUM the raw table and every recent day is inflated by however many times it has been re-fetched — and the multiple grows the more often you sync, so tightening your sync schedule makes reporting worse. This is the single most common cause of "our Amazon revenue is 3× too high".
The fix is one window function, applied once, in staging:
1-- staging.amazon_seller.sales_and_traffic_by_date (abridged)
2select
3    *
4from
5    (
6        select
7            cast(date as date) as date
8          , cast(ordered_product_sales_amount as numeric) as ordered_product_sales
9          , -- ...
10            -- Latest generation per date wins. Everything downstream can now
11            -- SUM freely without knowing this problem exists.
12            row_number() over (
13                partition by
14                    marketplace_id
15                  , cast(date as date)
16                order by
17                    _weld_synced desc
18            ) as generation_rank
19        from
20            {{raw.amazon_seller_central.sales_and_traffic_report_by_date}}
21    )
22where
23    generation_rank = 1
Do it in staging, not in the report. If it lives in the report, the next report will not have it.
Trap 2: the three ASIN reports are the same report
Amazon's Sales and Traffic report comes at three ASIN granularities, and a Weld sync lands all three:
| Table | Granularity |
|---|---|
sales_and_traffic_report_by_asin | one row per parent ASIN |
sales_and_traffic_report_by_asin_child | one row per child ASIN |
sales_and_traffic_report_by_asin_sku | one row per SKU |
All three have identical column lists — including parent_asin, child_asin and sku in every one of them — which makes them look interchangeable. They are the same sales, rolled up three ways. UNION two of them, or join them, and you double-count.
Pick one. The templates use the SKU grain, because it is the only one that joins to order and settlement data, both of which are keyed on SKU. Roll up to child or parent ASIN in the model, not by picking a different table.
Trap 3: traffic is measured on ASINs, not SKUs
This one is subtle enough to survive review. Sessions and page views belong to a product detail page, and a detail page belongs to a child ASIN — not to a SKU. So in the SKU-grain report, Amazon repeats the same session count on every SKU that shares an ASIN.
Which means SUM(sessions) over SKUs over-counts traffic, and every conversion rate you compute from it is understated by exactly that factor. Worse, the error scales with how many SKUs share an ASIN — so it is smallest on your newest products and largest on the restocked, repackaged, multi-SKU listings that matter most.
The fix is not clever, but the order matters:
1-- Traffic: MAX, not SUM. Identical across the SKUs of one ASIN.
2max(t.sessions) as sessions
3  , max(t.page_views) as page_views
4  , max(t.buy_box_percentage) as buy_box_percentage
5  , -- Sales: SUM. Genuinely per SKU.
6sum(t.units_ordered) as units_ordered
7  , sum(t.ordered_product_sales) as ordered_product_sales
8  , -- How many SKUs share this detail page. Anything above 1 is precisely the
9-- case that breaks a naive SKU-grain traffic query, so surface it.
10count(distinct t.sku) as sku_count
Roll traffic up with MAX per ASIN, units with SUM, then divide. Dividing first and averaging the per-SKU rates weights a SKU that sold one unit the same as one that sold a thousand.
Trap 4: settlement data is deleted after 89 days
Amazon does not retain settlement reports beyond 89 days, and no ELT tool can re-fetch what Amazon has deleted. Once synced, your warehouse holds the only copy of your Amazon fee history that exists.
Two consequences, both operational rather than analytical:
- Materialise everything downstream of settlements as tables, never views. A view that re-reads a stream whose history has aged out silently loses years of fees.
- Never full-refresh that stream. Resetting it is unrecoverable, and there is no warning.
The same logic applies more quietly elsewhere. fba_inventory_summary is a snapshot with no history at all, and Vendor Central's forecast keeps only the current generation. If you will ever want to trend those, enable history tables on the stream before you need them — none of it can be backfilled.
Part 3 — The event grain, so last month stops changing
Now the modelling. The intuitive approach is SUM(item_price) off the order report grouped by purchase_date. It looks right, it ties to Amazon for a fresh month, and then it drifts.
Here is why. A refund issued today reduces the day the order was placed. So last quarter's revenue changes after you have reported it, the same query returns two different answers a week apart, and nobody can explain it.
The fix is to stop treating a sale and its reversal as one fact. A row becomes a financial event: an order line produces a SALE row on its purchase date, and if it comes back it produces a separate RETURN row on the return date. Signs are set so the two compose by addition, with no special casing anywhere downstream:
gross_sales    positive on SALE, zero on RETURN
discounts      negative always
returns        zero on SALE, negative on RETURN
-----------------
net_sales      gross_sales + discounts + returns    <- plain addition
Row type is part of the grain, so a day where a SKU both sells and refunds produces two rows and each side stays independently auditable. Aggregate the row type away in BI.
Which order table to read
Amazon offers you a choice, and the obvious one is wrong.
The API gives you orders (header) and orderitems (lines). Both are current-state tables: they describe what an order looks like right now, which is structurally incapable of reproducing an event-based report. They also carry PII, so they are access-restricted.
orders_by_last_updated_date_report is the better source: one row per order line, every money column already on it, keyed on last_updated_date so it syncs incrementally, and no PII. Use the API pair only when you actually need buyer or address detail.
1-- staging.amazon_seller.orders (abridged)
2select
3    cast(amazon_order_id as string) as amazon_order_id
4  , cast(sku as string) as sku
5  , cast(purchase_date as date) as purchase_date
6  , cast(quantity as int64) as quantity
7  , cast(item_price as numeric) as item_price
8  , cast(item_tax as numeric) as item_tax
9  , -- Amazon reports promotion discounts as POSITIVE magnitudes. Flip the sign
10    -- once, here, so no downstream model has to remember which way round it is.
11    -1 * abs(cast(item_promotion_discount as numeric)) as item_promotion_discount
12  , -- Cancelled lines are KEPT, flagged rather than filtered. Amazon's own
13    -- ordered_product_sales nets cancellations out on the ORIGINAL order date, so
14    -- a model that drops the rows cannot reproduce that behaviour - and a model
15    -- that keeps them without a flag cannot exclude them either.
16    lower(cast(item_status as string)) = 'cancelled' as is_cancelled
17from
18    {{raw.amazon_seller_central.orders_by_last_updated_date_report}}
Returns: two reports, two very different grains
Amazon splits returns by fulfilment channel, and the two reports are not shaped the same way at all:
| Report | Channel | What it carries |
|---|---|---|
returns_by_return_date_report | Seller-fulfilled (MFN) | Refunded amount, label cost, SAFE-T reimbursements |
fba_returns_report | FBA | Units and condition only — no money at all |
Amazon leaves the FBA refund in the settlement report. So MFN returns can reverse value directly, while FBA returns reverse quantity and have to be valued at the SKU's average realised price — an explicit estimate rather than a silent zero:
1-- FBA returns carry no refunded amount, so value the reversed quantity at the
2-- SKU's average realised price. NULL average (a SKU never sold in the synced
3-- window) yields 0 rather than NULL, so the sales equation still holds.
4cast(
5    coalesce(f.return_quantity * p.avg_net_unit_price, 0) as numeric
6) as returns
7  , -- The distinction that decides what a return actually cost. A SELLABLE unit goes
8-- back on the shelf and you lost only the fees; anything else is gone and you
9-- lost the COGS too - typically a factor of two or three on true return cost.
10case
11    when f.is_resellable then abs(f.return_quantity)
12    else 0
13end as resellable_returned_quantity
Do not UNION the two reports in staging. Any account running both channels will double-count.
Reconciling to Amazon's headline. Sum
net_salesover theSALErows for a closed month and you land within a fraction of a percent ofordered_product_sales. It is not exact and it cannot be — Amazon does not document the cancellation and pending-order logic behind that figure. Treat a small, consistent gap as expected; treat a growing gap as a bug. The templates ship that as a drift test rather than an equality test.
Part 4 — The settlement report: what Amazon actually paid you
The settlement report is the only table in the connector that knows this, and it is the one nobody models. It is an event log: one row per financial event, positioned by posted_date, signed so the whole report sums to the deposit that hit your bank account.
Two columns drive everything. amount_type is a short, stable enum; amount_description is a long tail Amazon extends without notice. So classify off the first and only reach into the second where the first is genuinely ambiguous:
1-- staging.amazon_seller.settlement (abridged)
2case
3    when amount_type = 'itemprice'
4    and amount_description in ('principal', 'shipping', 'giftwrap') then 'revenue'
5    when amount_type = 'itemprice'
6    and amount_description like '%tax%' then 'tax_collected'
7    when amount_type = 'itemfees' then 'selling_fee'
8    when amount_type = 'orderfee' then 'selling_fee'
9    when amount_type like 'fba%' then 'fba_fee'
10    when amount_type = 'servicefee' then 'service_fee'
11    when amount_type = 'costofadvertising' then 'advertising'
12    when amount_type like '%reimbursement%' then 'reimbursement'
13    when amount_type is null then 'unclassified'
14    else 'other'
15end as ledger_category
16  , -- A refund is identified by transaction_type, NOT by a negative amount - a fee is
17-- also negative. Getting this backwards counts refunds as fees, so the fee ratio
18-- looks excellent while margin collapses.
19transaction_type in ('refund', 'chargeback', 'guaranteeclaim') as is_refund
Pivot those categories into columns and you have a P&L per order per SKU per day:
1-- core.amazon_seller.settlement_ledger (abridged)
2select
3    s.posted_date as date
4  , s.amazon_order_id
5  , s.sku
6  , -- What the customer paid.
7    round(
8        sum(
9            case
10                when s.ledger_category = 'revenue'
11                and not s.is_refund then s.amount
12                else 0
13            end
14        )
15      , 2
16    ) as product_revenue
17  , -- What Amazon took. All NEGATIVE - Amazon signs the report, and this model
18    -- preserves that. It is the only reason the total ties to the deposit.
19    round(
20        sum(
21            case
22                when s.ledger_category = 'selling_fee' then s.amount
23                else 0
24            end
25        )
26      , 2
27    ) as selling_fees
28  , round(
29        sum(
30            case
31                when s.ledger_category = 'fba_fee' then s.amount
32                else 0
33            end
34        )
35      , 2
36    ) as fba_fees
37  , round(
38        sum(
39            case
40                when s.ledger_category = 'advertising' then s.amount
41                else 0
42            end
43        )
44      , 2
45    ) as advertising_cost
46  , -- Refunded revenue is money returned to the customer. Refunded fees are the
47    -- part Amazon gives back - which is SMALLER than what it charged: the referral
48    -- fee is refunded, the FBA fulfilment fee generally is not. That asymmetry is
49    -- why a returned unit costs more than a unit never sold.
50    round(
51        sum(
52            case
53                when s.is_refund
54                and s.ledger_category in ('revenue', 'promotion') then s.amount
55                else 0
56            end
57        )
58      , 2
59    ) as refunded_revenue
60  , round(
61        sum(
62            case
63                when s.is_refund
64                and s.ledger_category in ('selling_fee', 'fba_fee') then s.amount
65                else 0
66            end
67        )
68      , 2
69    ) as refunded_fees
70  , -- Anything the classifier did not recognise. Should be zero. A non-zero total
71    -- means Amazon introduced an amount_type since this was written: the money is
72    -- still in net_proceeds, but it is in no named column.
73    round(
74        sum(
75            case
76                when s.ledger_category = 'unclassified' then s.amount
77                else 0
78            end
79        )
80      , 2
81    ) as unclassified_amounts
82  , -- The bottom line. A plain SUM of every line Amazon posted is, by
83    -- construction, what Amazon paid.
84    round(sum(s.amount), 2) as net_proceeds
85from
86    {{staging.amazon_seller.settlement}} s
87group by
88    1
89  , 2
90  , 3
Every fee column is negative, so net_proceeds is a sum, not a subtraction. Writing it with minus signs is how a fee ends up added back and margin comes out above 100%.
The one test worth more than the rest combined
Amazon publishes its own figure for what it paid you: settlement_description.total_amount. It is on your bank statement. Which makes it the only number in this entire exercise you can check against something external:
1-- tests/assert_settlement_ties_to_deposits.sql
2with
3    ledger as (
4        select
5            settlement_id
6          , sum(net_proceeds) as ledger_total
7        from
8            {{ ref('core_amazon_seller__settlement_ledger') }}
9        group by
10            1
11    )
12  , deposits as (
13        select
14            settlement_id
15          , deposit_date
16          , sum(deposit_amount) as deposit_total
17        from
18            {{ ref('stg_amazon_seller__settlement_period') }}
19        group by
20            1
21          , 2
22    )
23select
24    d.settlement_id
25  , d.deposit_date
26  , d.deposit_total
27  , l.ledger_total
28  , round(coalesce(l.ledger_total, 0) - d.deposit_total, 2) as diff
29from
30    deposits d
31    left join ledger l using (settlement_id)
32where
33    abs(coalesce(l.ledger_total, 0) - d.deposit_total) > 0.01
If it passes, the classification is complete and no line was dropped. If it fails, nothing downstream can be trusted, and there are three usual causes in order of likelihood: a settlement synced only partially, an INNER JOIN upstream that silently removed the account-level charges, or an ABS() somewhere that broke the sign convention.
Order-level lines carry no SKU. Storage fees, advertising and the monthly subscription are charged to the account, not to a product, and arrive with
skuNULL. Keep them — dropping them understates cost by your entire fixed-cost base, which is how a company reports a fee load ten points below its bank statement. It also means you cannotINNER JOINthis model to a SKU dimension.
Part 5 — ASIN profitability, and the date problem at its heart
This is the model everyone wants and almost nobody has, because it needs three reports that do not join to each other and disagree about what day it is:
| Component | Attributed to |
|---|---|
| Sales | the order date |
| Fees | the settlement date, days or weeks later |
| Returns | the return date, weeks later still |
There is no correct way to reconcile those on a single day, and pretending otherwise is the usual bug: join fees to sales by date and a SKU looks gloriously profitable on order day and catastrophic on settlement day.
The templates do not try. Each column keeps its own honest date, the joins are FULL OUTER three ways so a settlement landing on a day with no sale is not dropped, and contribution is only meaningful aggregated over a window long enough to contain both a sale and its settlement — a month, in practice.
1-- core.amazon_seller.asin_profitability (abridged)
2-- FULL OUTER, three ways: a settlement can post on a day with no sale, a
3-- reimbursement can post months after either. An INNER JOIN here silently drops
4-- fees for old orders, which flatters margin by exactly the amount you most
5-- want to see.
6from
7    sales s
8    full outer join fees f on f.date = s.date
9    and f.marketplace = s.marketplace
10    and f.sku = s.sku
11    full outer join reimbursements r on r.date = coalesce(s.date, f.date)
12    and r.sku = coalesce(s.sku, f.sku)
Two contribution columns, deliberately:
1-- Contribution after Amazon. Available on day one, without cost data - which is
2-- why it is separate from margin. Every fee is already negative, so this is a sum.
3round(
4    b.gross_revenue + b.returned_revenue + b.selling_fees + b.fba_fees + b.service_fees + b.advertising_cost + b.refunded_fees + b.return_label_cost + b.reimbursed_amount
5  , 2
6) as contribution_after_amazon
7  , -- Contribution after Amazon AND COGS. The actual answer, and NULL until you
8-- populate sku_cost - deliberately NULL rather than zero, because a zero renders
9-- as a healthy margin and gets quoted.
10round(
11    b.gross_revenue + b.returned_revenue + b.selling_fees + b.fba_fees + b.service_fees + b.advertising_cost + b.refunded_fees + b.return_label_cost + b.reimbursed_amount - (b.units_sold * c.unit_cost) - (
12        (
13            abs(b.returned_units) - b.resellable_returned_units
14        ) * c.unit_cost
15    )
16  , 2
17) as contribution_margin
COGS is the one model you have to write yourself
Amazon knows what it charged you in fees. It has no idea what your goods cost, so no report can supply it and no template can invent it. The contract is five columns:
1-- staging.amazon_seller.sku_cost - point this at whatever you actually have
2select
3    cast(sku as string) as sku
4  , cast(unit_cost as numeric) as unit_cost
5  , cast(valid_from as date) as valid_from
6  , -- NULL means "still current". Treated as open-ended, so do not backfill it
7    -- with a far-future date.
8    cast(valid_to as date) as valid_to
9from
10    {{raw.google_sheets.sku_cost}}
A maintained Google Sheet beats a perfect ERP model nobody updates. The validity window is the point: it makes cost point-in-time, so a January order is valued at January's cost. Flat current cost silently restates last year's margin every time a supplier price changes.
1-- Point-in-time cost: the window that contains the sale date, not today's price.
2left join {{staging.amazon_seller.sku_cost}} c on c.sku = b.sku
3and b.date >= c.valid_from
4and (
5    c.valid_to is null
6    or b.date < c.valid_to
7)
Keep the windows contiguous and non-overlapping. Overlapping windows fan out the join and overstate cost.
Part 6 — Vendor Central is a different business
If you have modelled Seller Central, unlearn most of it before starting here. As a vendor you sell to Amazon, and Amazon sells to the customer.
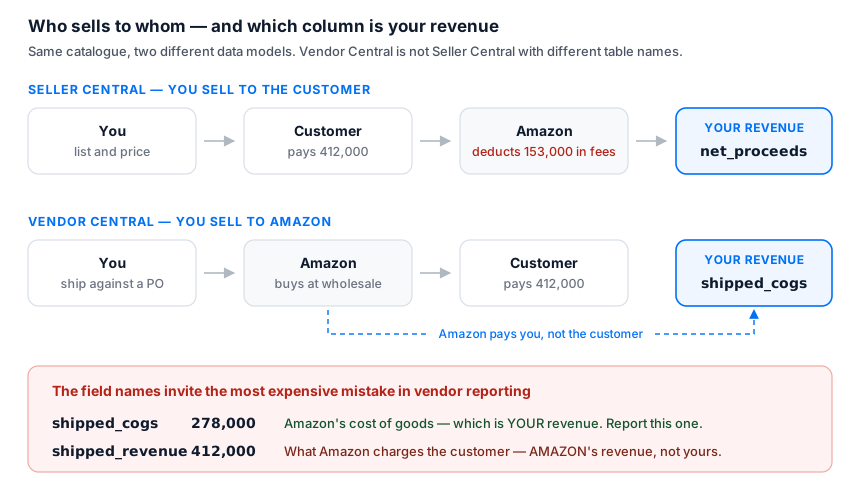
That single change cascades through the whole data model:
- There are no orders. No order table, no line items, nothing to aggregate up. Amazon reports daily aggregates per ASIN and that is all you get.
- Revenue is recognised on shipment, not on order.
ordered_revenueis a demand indicator. - There are no fees. Amazon buys at wholesale; the margin conversation is about cost price and co-op funding instead.
- Your revenue is
shipped_cogs.
That last one deserves its own warning, because Amazon's field naming actively invites the mistake:
shipped_cogsis your revenue.shipped_revenueis Amazon's.
shipped_cogsis Amazon's cost of goods — what Amazon pays you. That is your top line.shipped_revenueis what Amazon charges the customer: Amazon's revenue, not yours.Read the obvious one and your Amazon quarter looks ~48% better than it is. Every vendor that has ever presented a suspiciously excellent Amazon quarter reported
shipped_revenueby mistake — and unlike Seller Central, there is no order table to cross-check it against.
Put both on one row and derive the markup, which is the genuinely useful number:
1-- core.amazon_vendor.sales_over_time (abridged)
2select
3    s.date
4  , s.distributor_view
5  , s.selling_program
6  , -- Yours.
7    round(sum(s.shipped_cogs), 2) as shipped_cogs
8  , sum(s.shipped_units) as shipped_units
9  , -- Amazon's.
10    round(sum(s.shipped_revenue), 2) as shipped_revenue
11  , -- Amazon's gross markup on your product: retail minus wholesale, over retail.
12    -- A sharp drop means Amazon is discounting into its own margin, which usually
13    -- precedes being asked to fund it.
14    round(
15        safe_divide(
16            sum(s.shipped_revenue) - sum(s.shipped_cogs)
17          , nullif(sum(s.shipped_revenue), 0)
18        )
19      , 4
20    ) as amazon_gross_markup_rate
21  , -- Persistently ordered > shipped means Amazon wanted more than it could ship.
22    -- Lost sales - and this is the report where you can prove it.
23    sum(s.ordered_units) - sum(s.shipped_units) as ordered_minus_shipped_units
24from
25    {{staging.amazon_vendor.sales}} s
26group by
27    1
28  , 2
29  , 3
Every vendor sales report arrives four times
Amazon generates Vendor Sales and Vendor Inventory separately for each combination of two dimensions, and they all land in one table:
| Dimension | Values | Meaning |
|---|---|---|
distributor_view | MANUFACTURING | ASINs you manufacture, whoever sourced them |
SOURCING | ASINs sourced directly from your vendor group | |
selling_program | RETAIL | amazon.com consumer |
BUSINESS | Amazon Business (B2B) |
The variants overlap. An ASIN you both manufacture and source appears under both views, describing the same units. Sum across them and you double-count — for most vendors close to a clean 2×, which is exactly big enough to notice and exactly plausible enough to believe.
So both columns are part of the grain in every core model, which forces the choice to be explicit, and the analytics layer pins the sensible default:
1-- analytics.amazon_vendor.sales_over_time
2--
3-- ONE DISTRIBUTOR VIEW, ENFORCED HERE. Core keeps all four variants because they
4-- are legitimately different questions, but a dashboard that sums across them
5-- double-counts - and the person building the dashboard will not know that. So
6-- the filter lives in the contract rather than in a chart definition.
7select
8    *
9from
10    {{core.amazon_vendor.sales_over_time}}
11where
12    distributor_view = 'MANUFACTURING'
13    and selling_program = 'RETAIL'
MANUFACTURING + RETAIL is "how is my brand selling on Amazon" — the right default. Use SOURCING only when you specifically mean the products Amazon buys from you directly.
Traffic and margin are not split this way. Glance views and Net Pure Product Margin are reported per ASIN per day, full stop. Joined onto four-way-split sales they repeat on up to four rows, which multiplies traffic and divides every conversion rate by the same factor. Filter to one view, and LEFT JOIN rather than INNER — traffic reports lag sales, so an inner join silently drops the newest day, which is the day someone is looking at.
net_pure_product_marginis Amazon's margin, not yours. It is(Amazon's revenue − what Amazon paid you − co-op funding) / revenue. Worth tracking anyway: it is what your Vendor Manager is measured on, so watching it fall is advance notice of a conversation about cost price.
Part 7 — The vendor scorecard, and the forecast
The vendor sales numbers you could get from a weekly email. These you could not, and they are what gets quoted at you in a business review:
| Metric | Whose problem | Why it matters |
|---|---|---|
vendor_confirmation_rate | Yours | Share of units Amazon ordered that you confirmed. Below ~95% and Amazon treats you as unreliable supply — and orders less. |
average_vendor_lead_time_days | Yours | PO submission to receipt. Long lead times make Amazon carry more safety stock, which it offsets by ordering less. |
sell_through_rate | Shared | Slow turns lead to smaller POs. |
unhealthy_inventory_units | Amazon's, until it is yours | Excess versus forecast. Precedes a markdown request or a return-to-vendor. |
unfilled_customer_ordered_units | Amazon's | Customers ordered, Amazon could not ship. Lost sales you can prove. |
Vendor Central will not put those against your own velocity, which is the thing that makes them actionable — 400 units of unhealthy inventory is either two weeks of cover or two years of it, and the report alone cannot tell you which:
1-- core.amazon_vendor.inventory_health (abridged)
2-- Days of cover on what Amazon holds sellable. NULL rather than a huge number for
3-- an ASIN with no shipments: "unknown" is honest, and infinity sorts to the top of
4-- a well-stocked report and stays there.
5round(
6    safe_divide(
7        i.sellable_on_hand_inventory_units
8      , nullif(v.shipped_units_per_day, 0)
9    )
10  , 1
11) as days_of_cover
12  , -- Unhealthy inventory in weeks of demand. The number to bring to a business
13-- review: "eleven weeks of cover" is a conversation, "3,400 units" is not.
14round(
15    safe_divide(
16        i.unhealthy_inventory_units
17      , nullif(v.shipped_units_per_day * 7, 0)
18    )
19  , 1
20) as unhealthy_weeks_of_cover
The forecast is advance notice of your next PO
Amazon's demand forecast drives Amazon's purchase orders, at four confidence levels. mean is the expected value; p70/p80/p90 are the units Amazon is 70/80/90% confident of selling. Plan capacity against p80 or p90 — the mean is right half the time by construction — and read the spread between mean and p90 as how uncertain Amazon is, which is where safety stock belongs.
Scored against what actually shipped, it tells you something you cannot get anywhere else:
1-- core.amazon_vendor.forecast_vs_actuals (abridged)
2-- Error columns, populated only for FULLY ELAPSED windows. A partially elapsed
3-- window shows a large negative error that means nothing except that the period
4-- is not over - which is why these are deliberately NULL there.
5case
6    when f.forecast_end_date < current_date() then coalesce(a.actual_shipped_units, 0) - f.mean_forecast_units
7end as forecast_error_units
8  , -- Which confidence band the outcome landed in. If most ASINs realise below p70
9  , -- Amazon is systematically over-forecasting your catalogue and over-ordering -
10-- and that overstock becomes your markdown request. That is the finding worth
11-- escalating, and it needs a population, not one ASIN.
12case
13    when f.forecast_end_date >= current_date() then null
14    when coalesce(a.actual_shipped_units, 0) > f.p90_forecast_units then 'ABOVE_P90'
15    when coalesce(a.actual_shipped_units, 0) > f.p80_forecast_units then 'P80_TO_P90'
16    when coalesce(a.actual_shipped_units, 0) > f.p70_forecast_units then 'P70_TO_P80'
17    when coalesce(a.actual_shipped_units, 0) > f.mean_forecast_units then 'MEAN_TO_P70'
18    else 'BELOW_MEAN'
19end as realised_band
One structural limitation, and it is worth knowing before you present this. Amazon retains only the current forecast. So a realised window is scored against whatever forecast was live when you last synced — which, for a window already past, may have been revised toward the outcome. Real forecast accuracy needs the forecast as it stood before the window opened, which means retaining generations: enable history tables on the
vendor_forecasting_reportstream and read the history table instead. You cannot backfill this. Until then, treat the error columns as indicative rather than as a KPI.
Part 8 — Deploying the Amazon SQL templates
What already exists on dbt Hub
Two packages cover Amazon Seller Central. Worth knowing where they stop before you write anything yourself.
fivetran/dbt_amazon_selling_partner is the maintained one, and the right answer if you are on Fivetran. It turns the API object tables — orders, order items, catalog, FBA inventory — into three enriched models, and it is properly documented with a DAG and dbt Docs. It does not read the settlement report, the Business Reports or the returns reports, and its README says plainly that it is not compatible with Vendor Central modules.
Saras-Daton/AmazonSellerCentral is a unification layer for Saras Analytics' own Daton connector: one model per raw report, handling consolidation across marketplaces, de-duplication, and optional currency and timezone conversion. Wider source coverage — it does unnest the financial events — but the output is flattened raw tables rather than reports. Last updated January 2024.
| Fivetran | Saras-Daton | These templates | |
|---|---|---|---|
| Built for | Fivetran connector | Daton connector | Weld connector, plain SQL |
| Layers | staging + 3 marts | unification only | staging + reports + BI contracts |
| Orders | current-state | current-state | event grain, returns on the refund date |
| Sessions, conversion, Buy Box | — | raw, child-ASIN grain | modelled, de-duplicated |
| Fees and payouts | — | raw financial events | ledger that ties to the deposit |
| Returns | — | raw | MFN and FBA, valued separately |
| ASIN profitability | — | — | yes |
| Vendor Central | — | — | yes |
This is not a criticism of either. They are solving the loading problem, against a different connector, and doing it well. But if your question is what is this ASIN actually worth, neither will answer it — and on the vendor side there is nothing at all.
Worth saying plainly: which loader you use and which models you run are separate decisions. These templates are plain SQL and will run against any of them with the source names repointed. If you are still choosing a loader, we keep a comparison of Fivetran alternatives and a breakdown of Fivetran's pricing — but nothing below depends on that choice.
One thing the Daton package is useful independent evidence for: its README lists data duplication from Amazon's report look-back window as one of the three typical problems with raw Seller Central data, and its models de-duplicate with the same row_number() … qualify = 1 pattern used in Trap 1 above. That trap is not a Weld quirk. It is how Amazon's reporting API behaves, and every serious Amazon package has to deal with it.
The four layers
Four layers, both connectors, same shape as the Shopify templates:
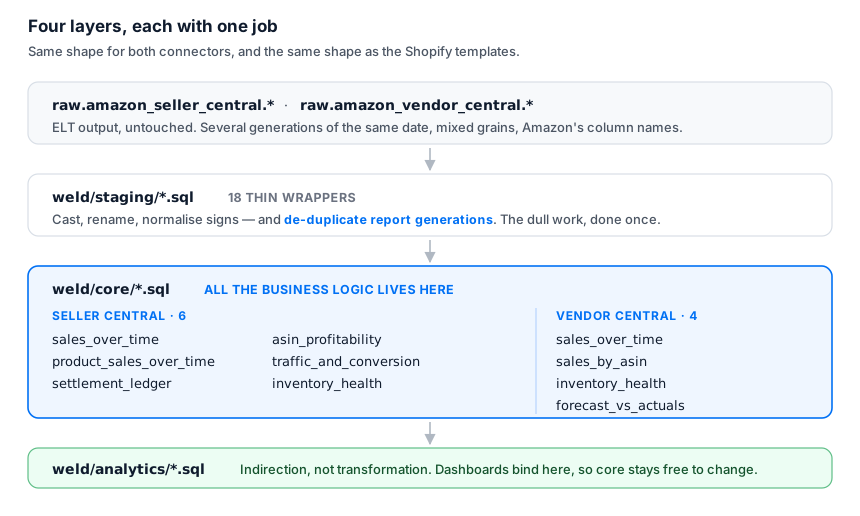
Staging does the dull work once — cast, rename, normalise signs, and above all de-duplicate report generations — so core holds only reporting logic. Core is where the sales equation, the fee classification and the profitability joins live; this is the layer worth reviewing. Analytics exists for indirection, not transformation: dashboards bind to analytics.amazon_seller.sales_over_time, so core stays free to be renamed, re-grained or split. Most are SELECT *, and that is the point.
Weld or dbt
The templates ship in both dialects, generated from the same source so they cannot disagree about what the sales equation is. The only difference is ref syntax:
1-- Weld: references map to folder paths
2from
3    {{staging.amazon_seller.orders}}
4    -- dbt: the same model, same logic
5from
6    {{ ref('stg_amazon_seller__orders') }}
With GitHub Sync a push deploys all of them and Weld resolves the dependency order. If you already run dbt, copy dbt/models/ into your project and repoint sources.yml — the models set their own config() so they stay drop-in, with no dbt_project.yml changes needed.
Multiple accounts and marketplaces
Every staging model emits an amazon_seller (or amazon_vendor) label, and it is part of every join key and of the grain in core. To add an account or region, UNION ALL a second block in each staging model with a different label — and change nothing else. Order IDs are only unique within an account, so dropping the label from one join would silently fan rows out across accounts.
The tests that matter
Nine test files ship with the templates — eight distinct checks, with the de-duplication guard present in both connectors. They are weighted toward the ones that check against something external:
| Test | Catches |
|---|---|
assert_settlement_ties_to_deposits | An incomplete fee classification, against Amazon's own deposit figure |
assert_no_duplicate_report_generations | Trap 1, silently returning, in both connectors |
assert_sales_equation_holds | A sign flip in staging |
assert_product_sales_track_business_report | Drift from Amazon's headline, month by month — not equality |
assert_cogs_does_not_exceed_retail | shipped_cogs and shipped_revenue swapped |
assert_distributor_views_are_not_summed | How much your MANUFACTURING/SOURCING sets actually overlap |
assert_traffic_is_not_multiplied_by_views | Glance views inflated by the four-way join |
assert_marketplace_keys_are_consistent | A staging model keying the marketplace by name instead of ID |
The last two are unusual in that a failure is information rather than a defect — they measure the size of the error you would be making if you summed across variants, so you can decide knowingly.
Get the templates
Everything above, ready to copy, in both dialects:
- Amazon Seller Central — 6 core models, 12 staging, 5 tests
- Amazon Vendor Central — 4 core models, 6 staging, 4 tests
- The full SQL template library
Written for BigQuery; the logic ports to Snowflake, Databricks, Redshift or Postgres with minor dialect changes. Treat every model as unverified until you have reconciled it — a closed month against Seller Central, and one settlement against your bank statement. That second check is the one that will surprise you.
Getting the data into the warehouse in the first place is the Amazon Selling Partner and Amazon Vendor Central connectors — both support Weld's shared OAuth or your own SP-API app credentials, so there is nothing to register if you do not want to.
If you are also on Shopify, the equivalent guides are How to build a Shopify sales report with SQL and the dbt version. And if your Amazon numbers already disagree with your dashboard, Amazon dashboard discrepancies covers the reconciliation side.