
Before you write a single line of SQL against a new source, you need to know what you are working with. Which tables come out of the connector, what the columns are called, and how the tables join.
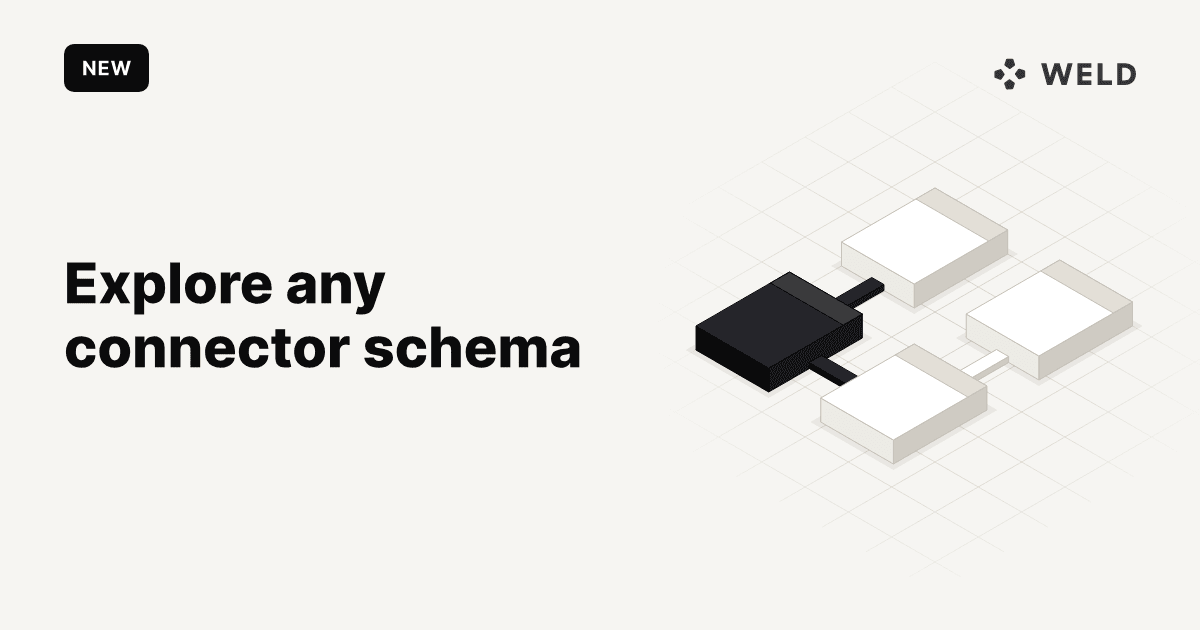
That is what the ERD viewer on every Weld connector page is for, and we have just rebuilt it. The schema browser and the diagram now sit side by side, one search covers every table and column, and clicking a table shows you exactly what it joins to.
TL;DR: The new ERD viewer shows the table list and the entity relationship diagram together, with a shared selection: pick a table or column in one and the other follows. Search runs across tables and columns at once, clicking a table traces its joins, and edges are routed around the tables so you can actually follow them.
See it in action
Here is the new viewer on Shopify's schema. We search for customer_id, pick it in the order table, and then trace how product connects to the rest of the model.
What's new
The browser and the diagram, side by side
The schema browser and the diagram used to be two tabs of the same view, so you were always flipping between a list you could read and a picture you could not search. Now the browser sits on the left and the diagram on the right, and they share one selection.
Pick a table in the list and the diagram pans to it. Pick a column and the diagram pans to the table, then highlights that row. Clear the selection and the whole schema is framed again.
One search across tables and columns
The search box looks through table names and column names together, and opens every table it matched so you can see the hits in place.
On Shopify, searching customer_id narrows 58 tables down to the 8 that carry it, from order and draft_order to abandoned_checkout and customer_address. That is the fastest way we know to answer "where can I join customers in?" without reading the docs.
Click a table to trace it
Click any table in the diagram and its relationships light up in blue, while everything unrelated fades back. Click empty canvas to reset.
Tables that a connector splits into sub-tables are grouped in a dashed container. On Shopify, order sits together with order_line_items and the other nested parts of an order, so you can see at a glance which tables belong to the same object.
Edges you can follow
The old diagram drew curved lines that often ran straight through the tables in between. The new one routes every edge at right angles around the tables, with as few bends as it can manage, so you can trace a line from one end to the other.
The layout itself is the one our team settled on for each connector, so related tables sit next to each other instead of being scattered by an automatic layout.
And the small things
- A full-page view. Open the schema in its own page, and the close button takes you back to the connector page or docs page you came from.
- Dark mode works throughout, including the full-page view.
- Long names fit. Table and column names that run long are truncated with a tooltip rather than scrolling sideways.
- On mobile, the browser and the diagram become two tabs, so the list stays usable on a small screen.
A Shopify walkthrough
Shopify is a good example because its schema is big: 58 tables, and the order table alone has 136 columns. Here is how you would get your bearings in it.
- Start from the question. Say you want revenue per customer. Search
customer_idand you will find it onorder, which is where the money lives. - Pick the column. Click
order › customer_idin the list. The diagram pans toorder, highlights the row, and shows the edge back tocustomer. - Follow the joins out. With
orderselected, its edges totransactionandfulfillment_orderlight up too. That tells you where payments and shipping data join in. - Trace the products. Click
productin the diagram and you can see it joins throughorder_line_itemsonproduct_id, not toorderdirectly. That is the join you need for revenue per product.
You can try it on the live Shopify schema below. Click it to open the full-page explorer.
Where to find it
The new viewer is live on every connector page that has a schema diagram, in the connector docs, and as a full-page view at weld.app/connectors/<connector>/schema. For Shopify, that is weld.app/connectors/shopify/schema.
Where we publish a connector's tables without a diagram, you get the same search and a columns pane for the table you pick.
FAQ
What is an ERD?
An ERD, or entity relationship diagram, is a map of a data model. It shows the tables, the columns in each one, and how the tables relate to each other through keys. For a connector, it shows the tables Weld syncs into your warehouse and how to join them.
Which connectors have an ERD?
Shopify and many other Weld connectors have a schema diagram on their connector page. Where we publish a connector's tables without a diagram, you still get a searchable list of its tables and columns.
Do I need a Weld account to use the ERD viewer?
No. The viewer is on the public connector pages and docs, so you can explore a source's schema before you connect it.
How do I find which tables contain a column?
Type the column name in the search box above the table list. The viewer opens every table that has a matching column and shows the matching columns in place. Pick one to jump to it in the diagram.
How do I see what a table joins to?
Click the table in the diagram. Its relationships are highlighted in blue and every unrelated table fades back. Click empty canvas to clear the selection.