
You’ve probably heard the famous saying: what isn’t measured can’t be improved.
As a marketing leader, this mindset is fundamental to the way I operate. Generally speaking, I believe that most growth and marketing initiatives can (and should) be measured. Otherwise, we have no way of knowing how they perform, and increasing their impact becomes a guessing game.
But writing about this is relatively easy – actually doing it is the hard part. You need to decide what to track, choose the tool(s) for data collection, transformation, and visualization, create your business definitions (also known as metrics; for example, Customer Acquisition Cost), ensure your data is always accurate and up-to-date, and the list goes on. For simplicity’s sake, I’ll group all of these operations under the umbrella term Marketing Analytics.
In this article, I’ll dive into what Marketing Analytics is, how to get started with it, and the tools you should consider as the easiest and fastest way to begin your marketing analytics journey.
What's in the article…
- What is Marketing Analytics?
- Getting started with Marketing Analytics
- Choose a data warehouse
- Create your ETL syncs
- Create your metrics
- Start visualizing your data
What is marketing analytics?
Marketing analytics is the process of tracking and measuring the various components of marketing to understand and improve the overall performance of your marketing department.
Here are a few examples of the marketing components that could be tracked as part of a company’s marketing analytics effort:
- Advertising spend
- Number of customers
- Daily Active Users
- Email open rates
- Click-through rates (CTR)
- Website sessions
- Unique visitors
- Website conversion rate
- Ad impressions
- Revenue
The list goes on. There isn’t a definitive list of everything that should be tracked, because there are endless possibilities. What you choose to track will change depending on the stage, size, and industry of your business. For example, an e-commerce company with low margins might focus closely on website conversion rates—where even a slight percentage change can have a significant impact—whereas this might be less critical for SaaS companies with higher margins and large annual contracts.
It’s also important to note that marketing analytics goes one step further than simply collecting raw data points. For instance, looking at Revenue alone doesn’t tell the full story—you might see a 50% month-over-month revenue increase but also a 75% increase in advertising spend. In that case, your gross margins would actually be lower, painting a very different picture than standalone revenue would suggest.
That’s why I also include metrics (achieved through data modelling) in my definition of Marketing Analytics. When you combine different pieces of data, you can enable deeper analysis and understanding. For example, coupling Revenue and Ad Spend can help you calculate Return on Ad Spend (ROAS), which you can then analyze by day, month, quarter, or even by cohort. The same goes for popular metrics like Customer Acquisition Cost (CAC), Customer Lifetime Value (LTV), and Customer Health Score.
Getting started with marketing analytics
Now that you have a better understanding of what marketing analytics is, you might be wondering how to set up a marketing analytics structure.
It might seem like a daunting task, but the good news is that data tooling and technology have become significantly cheaper, easier to use, and faster to set up in recent years.
If I were a marketing manager starting at a new startup or company today without a marketing analytics setup, here’s what I’d do:
1. Get a data warehouse
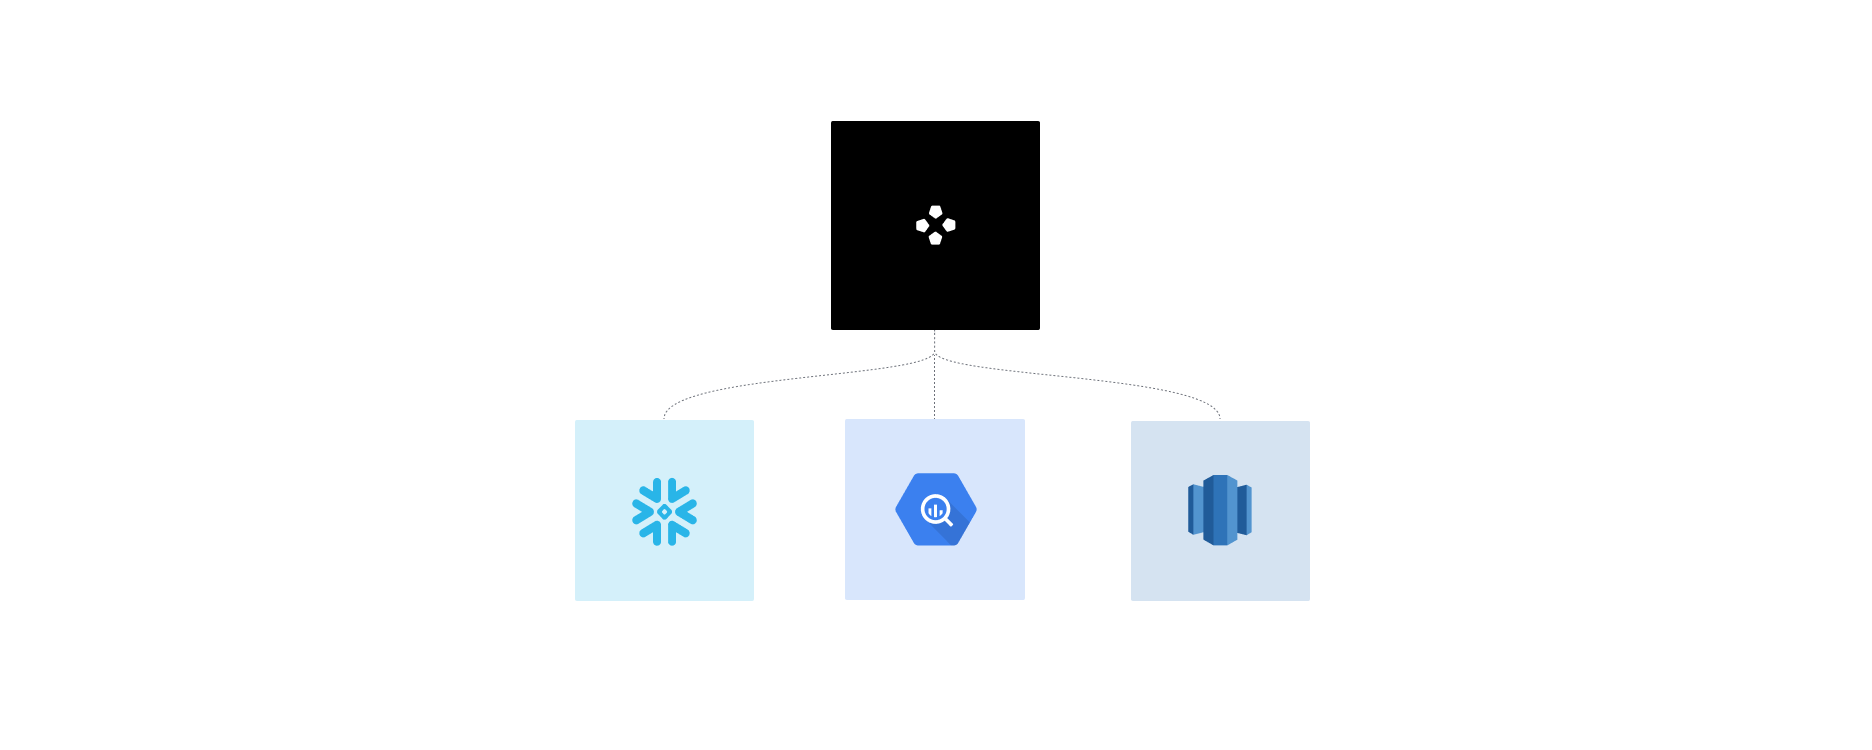
Getting a data warehouse is the first and most important step to building any data and analytics infrastructure. Simply put, there's no modern data stack without a data warehouse. This is where you’ll stream all your customer data from various tools and databases (also known as sources). Without this critical piece of infrastructure, aggregating data from multiple sources and creating a single source of truth is both difficult and expensive—especially if you have dozens (or even hundreds) of data sources. The most popular data warehouses include Google BigQuery, Snowflake, and Amazon Redshift.
2. Get an ETL tool
Having a data warehouse is only part of the equation—it needs to be loaded with customer data. That’s where an ETL (Extract, Transform and Load) or ELT tool comes in. These tools take customer data from your sources (e.g. Hubspot, Salesforce, Google Ads) and replicate it to your data warehouse at a predefined frequency.

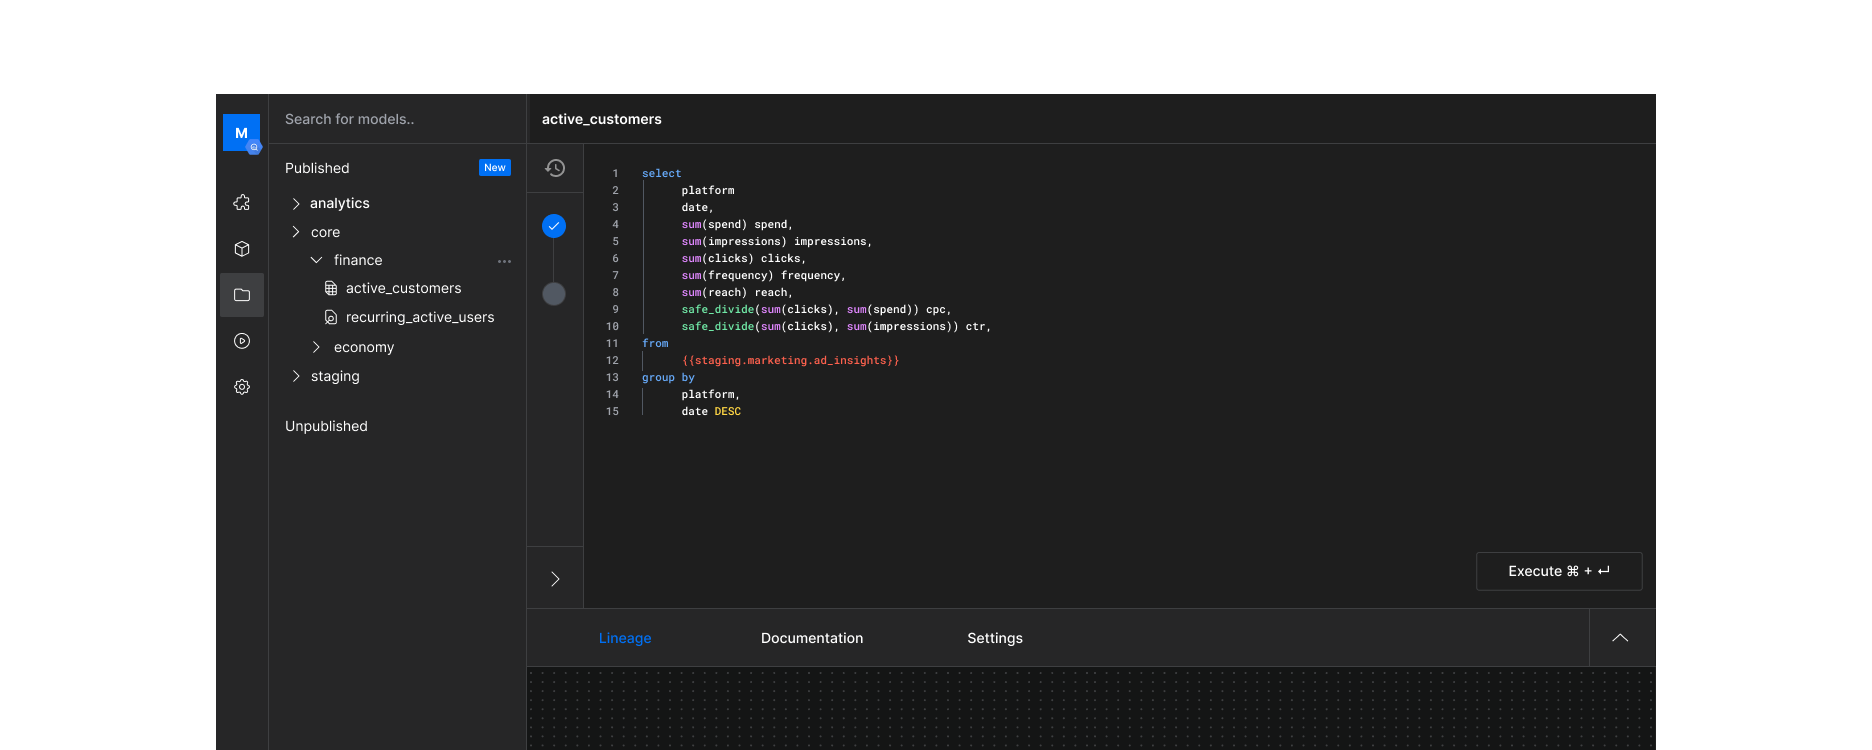
3. Get a modelling tool, and create your metrics
Once your data warehouse is set up and your ETL syncs are running, it’s time to actually do something with that data. This is where you create your metrics—the business definitions that everyone in your team and company can align on.
After this step, you’ll have defined the core metrics you want to track—such as CAC, LTV, health score, and ROAS.
4. Get a data visualization tool
With your data models saved in your data warehouse and updated frequently via your ETL pipelines, the final step is to get a data visualization tool.
There are several great options available, but I’d recommend Metabase. I’ve been using it for marketing analytics for the last five years and have always been extremely satisfied with its functionality.
Getting your metrics into your visualization tool is straightforward and requires no custom code or scripts with Weld—just connect it, and you’re set.
One of the many advantages of this setup is that it’s the only way to gather all your customer information in one central location and have it stay up to date automatically. You only need to connect your tools and create your metrics once, and they’ll remain accurate for use in any data visualization tool you choose—beyond just spreadsheets.
Ready to Get Started?
Hopefully, by now, you have a good understanding of what marketing analytics is, what to track, and how to get started. If you need help getting up and running or would like advice on tooling, metrics, dashboards, or anything in between, don’t hesitate to reach out to me or one of the team members at Weld—we’re happy to help! If you know your way around SQL and want to give Weld a try, jump right in! It’s free to get started.