Data visualization tools are an essential piece of the Modern Data Stacks companies are building (or buying) to fuel their efforts to become truly data-driven. Modern leaders want the data on how their business is performing, and Data Analytics teams have the important responsibility of turning raw company data into clear, comprehensive insights that can drive real business outcomes.
The key to their success? Clear visuals that give key insights into company performance and customer behaviour. To help you produce the best data visuals, we’ve rounded up the top data visualization software picks for data teams of today! Keep reading to learn the pros and cons of each platform, and find the best tool for your needs.
Top 7 Data Visualization Software 1. Metabase 2. Microsoft Power BI 3. Looker 4. Tableau 5. Google Data Studio 6. Zoho Analytics 7. Datawrapper
What is data visualization?
Data visualization is exactly what it sounds like: a way for you to represent your data visually. It's a useful way to turn abstract and vast quantities of data into a simple visual that anyone on your team can understand at a glance, and it can be done in a number of ways.
Types of data visualization
- Bar graph
- Pie chart
- Heat map
- Statistical graph
- Dot distribution map
- Word cloud
- Treemap
Essentially, any representation of data through images and other visuals is a type of data visualization. With the advancement of technology and more data visualization companies on the market, the art of data visualization is more mature than ever before. It can be just as practical as it is creative, depending on the purpose and audience that data visuals are being produced for.
Just as there are many types of data visualization, there are a number of ways companies can use those visuals to inform their decision making and strategic approach. This is what’s called ‘data activation’ and is an important piece of data-driven business (more on that later). [

](https://weld.app/ebooks/the-data-activation-playbook) 💡 The #1 missing piece to data-driven business is data activation. Find 7 tactics to turn insights into action in our Data Activation Playbook →
7 data visualization tools for scaling companies
So, how can Data Analysts and Data Scientists start creating the clear, compelling visuals that their companies really need? It starts with finding the perfect data visualization software to suit your needs. Here are 7 of the best-in-class data visualization companies on the market, and a brief overview of what they’re best for.
1. Metabase
First up is Metabase. Metabase is not only one of the best data visualization tools available today, it's also our personal recommendation for most companies. This is primarily based on Metabase's flexibility. It can be as complex or as simple as you need it to be, and it can switch between the two at a moment's notice.
This means that everyone on your team, from your CEO to your customer support staff to your tech-savvy researchers, can dig up the data they need in no time. It works with a wide variety of databases, including Amazon Redshift, Google BigQuery, PostgreSQL and Snowflake.
It’s also open-source and includes a generous free plan that suffices for most companies to visualize their data in an effective and intuitive way. On top of that, its design is thoughtful and minimalistic, and it’s packed with user-friendly features that allow people who aren’t familiar with SQL to build dashboards and reports without it.

2. Microsoft Power BI
Next in line is Power BI. Developed by Microsoft, this data visualization tool is extremely powerful for businesses that are already plugged into the Microsoft Office ecosystem. For one thing, it works very similarly to other Office apps. If you've used Microsoft Word or Excel, you'll feel right at home with this app. And it integrates easily with the rest of the Microsoft Suite.
Beyond its familiarity, Power BI manages to bring sophisticated features in addition to the friendly face. It includes built-in AI capabilities, data security features, and can easily scale with your business. It's used by some of the biggest companies in the world, such as Adobe, making it a product you know you can trust. And, you can try it out for free — which is great, because there aren't many free data visualization tools out there.
3. Looker
Looker is another extremely popular option among start-ups, scale-ups and larger companies. It’s mainly loved for its great customization capabilities, library of visualizations, ease of use and large number of integrations with big data platforms and databases.
It also offers analytics code blocks with SQL patterns that are customizable to your specific needs. On top of that, embedded in the experience is an easy link-sharing capability that makes collaborating with teams simple and straightforward.
Some of the downsides, however, include a lack of flexibility within the system (mainly due to how simple the tool is) and sometimes long load times for large dashboards that contain heavy amounts of data.
Also, without an external tool, getting your marketing data into Looker is a very manual process — you can either use spreadsheets or build APIs in-house (which is very resource intensive).
Make data activation easier with Weld — From ELT to reverse-ETL and a built-in data model hub, it’s easy to keep things organized and streamlined. Plus, Weld integrates easily with your data visualization tool of choice. Try it free!
4. Tableau
Tableau is a unique data visualization company in that it has a strong focus on community. Not only can you interact directly with other Tableau users to share support and creativity, but Tableau also hosts free virtual conferences where you can learn more about customer data analytics. Plus, the platform is free to try.
It's a popular platform for businesses of all sizes, though it's worth noting that Tableau is targeted towards leaders, analysts, and IT. You might have a hard time including other people in your business in Tableau.
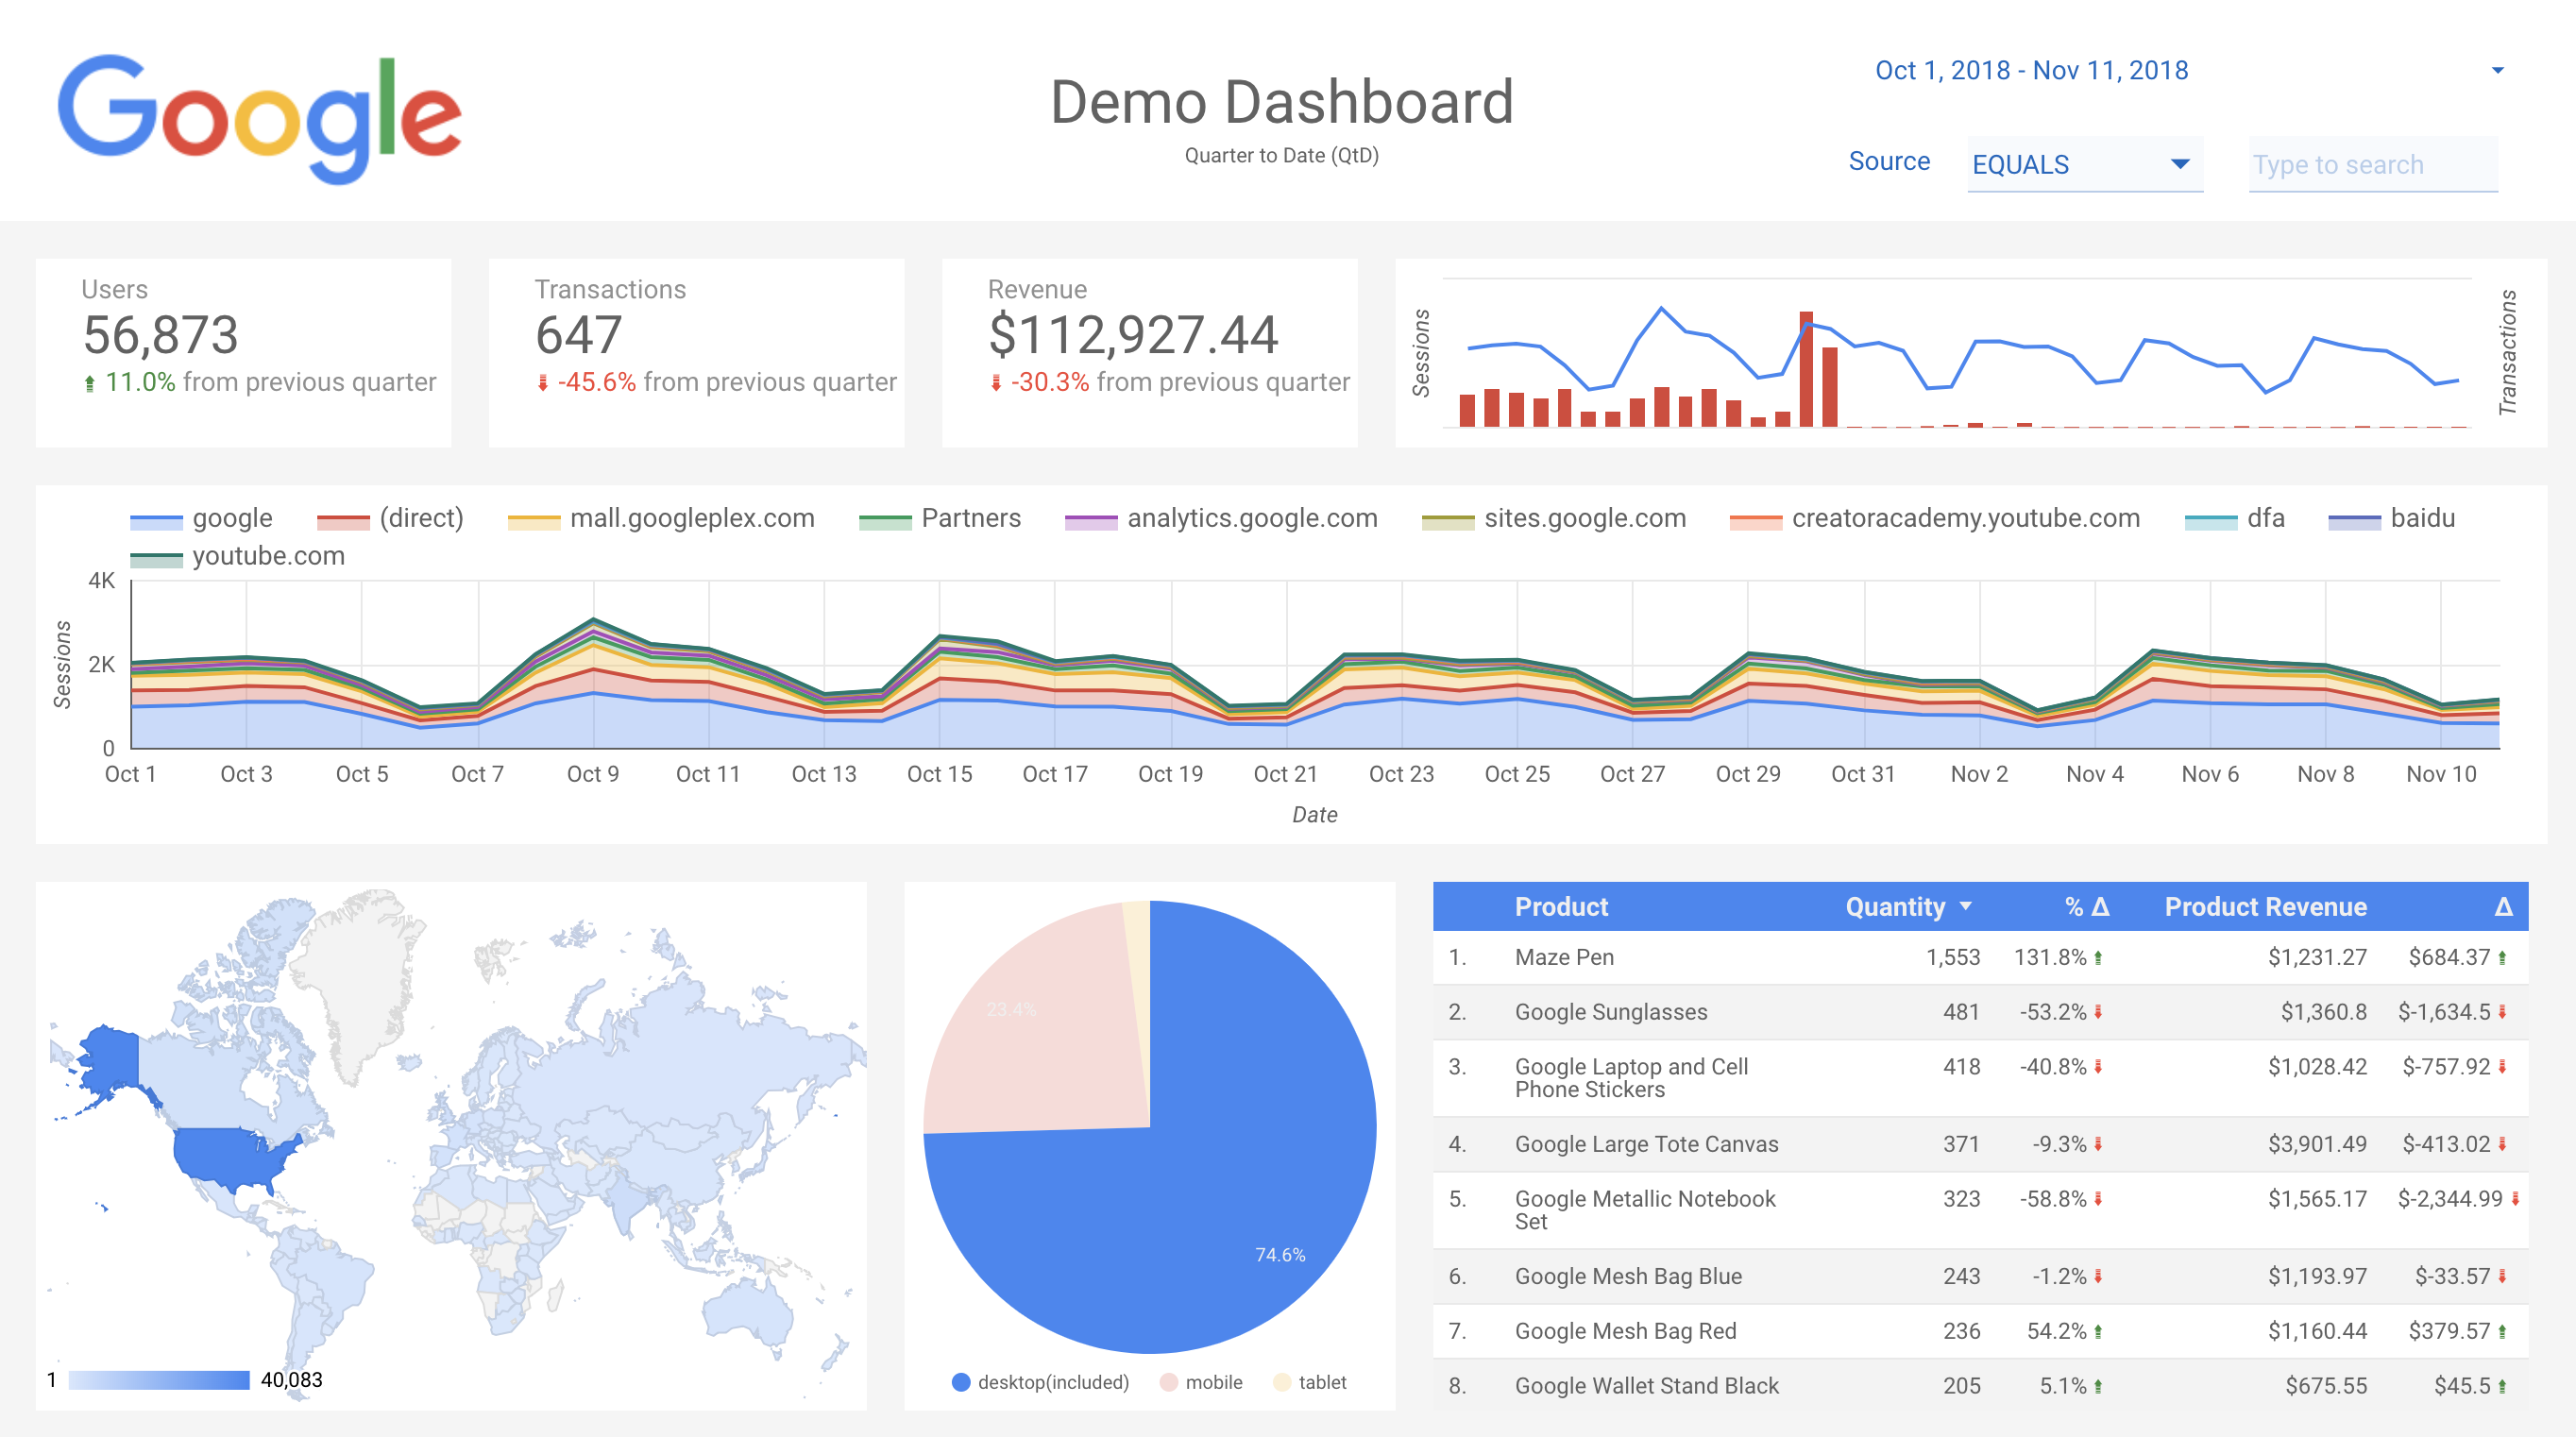
5. Google Data Studio
Unsurprisingly, there's a Google app for data visualization as well, and it's Google Data Studio. Like every tool that Google releases, Google Data Studio is web-based, super easy to use, free, and reliable. It comes free with the rest of the Google Suite, but it won't have the same level of depth or simplicity that other tools can offer.
Still, if you're looking for a simple, straightforward data visualization tool, Google Data Studio meets you where you are. Many companies who are just getting off the ground start analyzing their data with Google Data Studio. As you can imagine, it connects seamlessly with Google Analytics, making basic traffic and marketing analytics a piece of cake.
6. Zoho Analytics
Zoho Analytics is another great data visualization company, though it's geared towards users who want to dive into all of Zoho's services. There is a (limited) free version of the tool so you can test it out or use it if you're a smaller team. Similar to Power BI, you're going to get more out of this service if you pair it with other Zoho apps. If you're already in the Zoho ecosystem, this tool is a no-brainer.
This customer data visualization tool is highly scalable, secure, and packed with advanced features. It uses machine learning to deliver fast insights, has an AI that you can hold a conversation with, and more. The downside is that the API connections to non-Zoho products can be unreliable. It can make reporting with external data rather cumbersome.
7. Datawrapper
Our final recommendation is Datawrapper. Datawrapper is a great data visualization tool for businesses with simple back-end data. It doesn't integrate with existing services — instead, it accepts data that’s copied and pasted into it or imported through a CSV/XLS file. Datawrapper also offers a free version of their data visualization software, beyond just a free trial period.
Once your data has been added to this platform, you'll be able to quickly generate highly visual renderings of your data. This is Datawrapper's strength: the visualizations it produces are artistic and classy, making it valuable for B2C brands that want to share data with their audience.
The benefits of data visualization for fast-growing companies
Customer data is at the heart of modern business, and more and more companies are using it to make smarter, more strategic decisions. But to get there, the data needs to be digestible and accessible to leadership, stakeholders, and non-technical employees alike. When everyone at an organization can access and understand the data, that’s when companies truly start to adopt a data-led approach, and build a data culture.
The benefits of data visualization are as easy to grasp as data visualization itself. Businesses that visualize their data in an easy-to-understand format can share and digest information faster. Simply put, there's less explaining! You can quickly send or show your team visualizations of your data with a brief description. It's more efficient and more enlightening.
For fast-growing companies, data visualization is a must. It helps catch everyone up to speed quickly, especially for new joiners. You can use data visualizations to quickly communicate your progress, goals, and service to those outside of your business. That makes it an effective tool for sharing information with investors, the media, and others.
Tying it all together
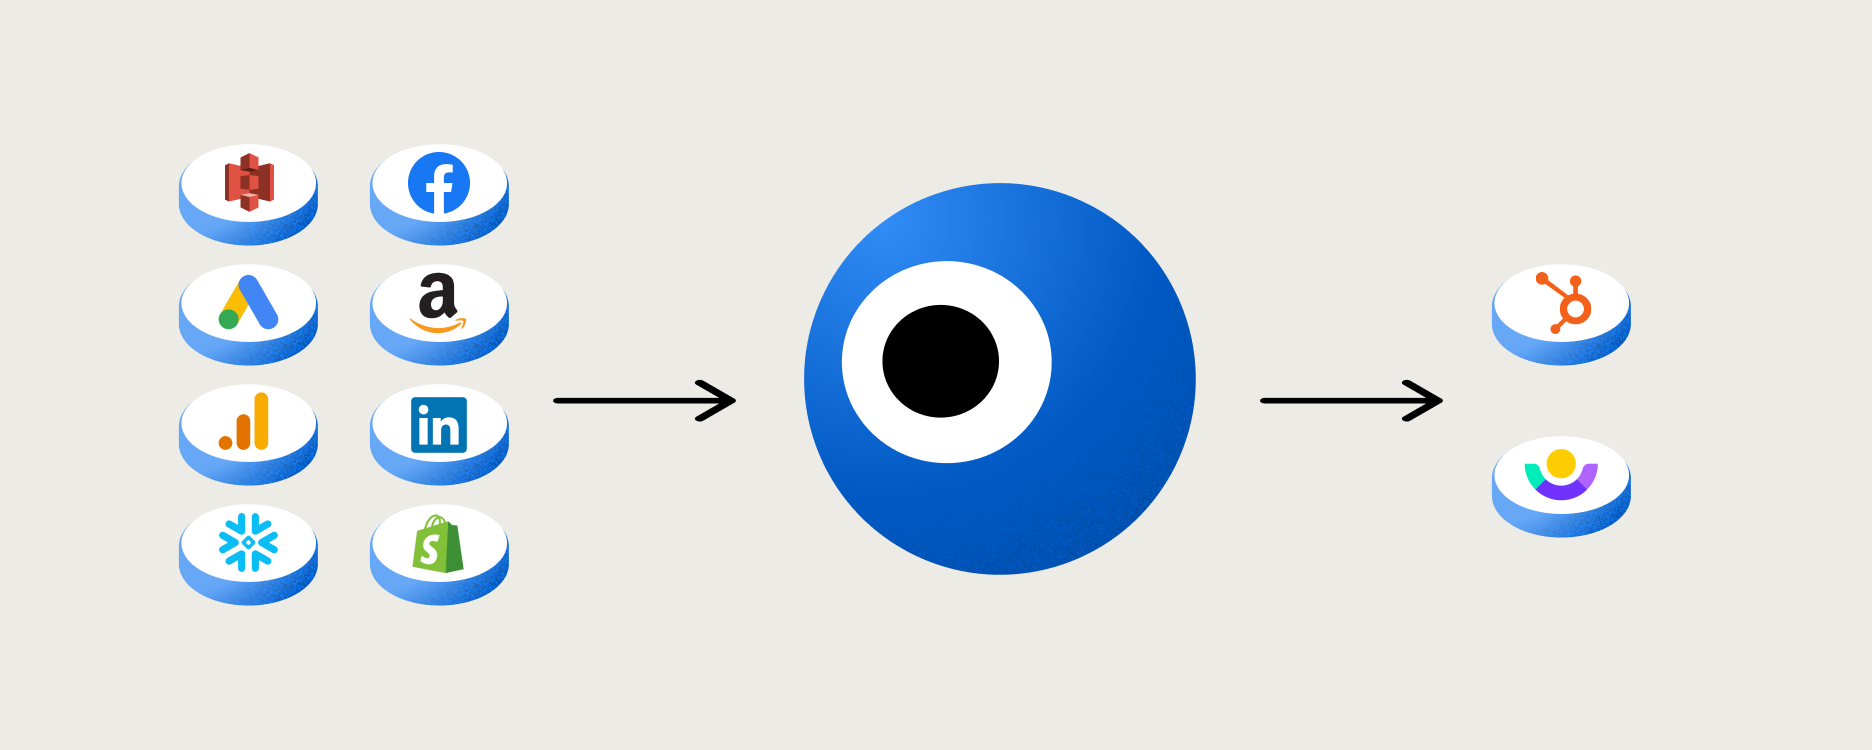
Pie charts, tables and graphs help inform business decisions. But this is just one piece of the puzzle of truly data-led growth. Getting your precious customer data centralized in your data warehouse, modelling it, and then pushing it out into your data visualization tool and SaaS apps is what really embeds data into the flow of work at your company.
So how do you achieve this? An end-to-end data platform like Weld helps businesses of every size become data-driven faster than ever before. Give it a try for free or speak with one of our data experts to learn how Weld can help you achieve your data goals — and reclaim precious time.