
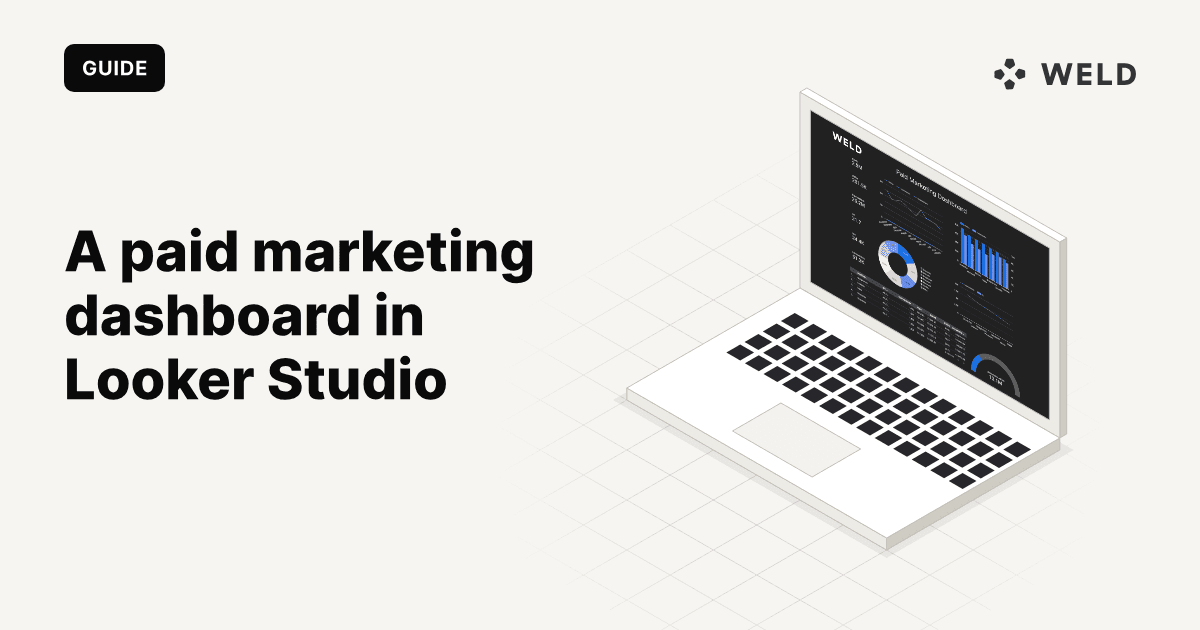
A paid marketing dashboard answers three questions every week: how much did we spend, what did it bring in, and which channel or campaign should get the next dollar. Looker Studio is free and good at drawing the answers. The hard part is the data underneath, because Meta, Google, LinkedIn and TikTok each report spend, clicks and conversions in their own way.
Most guides solve that by blending the platforms inside Looker Studio. This guide does it differently: one table in your warehouse that holds every channel in the same columns, and a Looker Studio report that reads only that table. You get the metrics to show, the reasons blends go wrong, the SQL for the model, a worked example and a checklist for numbers that match Ads Manager.
What a paid marketing dashboard should show
Keep the first version small. These ten metrics cover almost every paid media review.
| Metric | Formula | What it tells you |
|---|---|---|
| Spend | sum of spend | What you paid the platforms |
| Impressions | sum of impressions | Reach of the delivery, before anyone clicks |
| Clicks | sum of clicks | Traffic you bought |
| CTR | clicks / impressions | How well the ads earn attention |
| CPC | spend / clicks | Price of a visit |
| CPM | spend / impressions × 1,000 | Price of attention, useful across formats |
| Conversions | sum of conversions | Results as each platform counts them |
| CPA | spend / conversions | Price of a result |
| Conversion value | sum of conversion value | Revenue the platforms attribute to the ads |
| ROAS | conversion value / spend | Return on each unit of spend |
Every rate in that table is a ratio of sums: add up the base columns for the period and the channels you are looking at, then divide. Never average the daily or per-channel rates. The worked example below shows how far the two can drift apart.
Why blending platforms in Looker Studio breaks
Looker Studio has a native Google Ads connector. Meta, LinkedIn and TikTok need a partner connector or a warehouse. Once each platform is its own data source, the usual next step is a blend. Blends have hard limits, all from Google's own documentation:
- Five sources at most. A blend holds up to five data sources or tables. Four ad platforms plus a revenue source already fills it.
- Union removes duplicate rows. When you stack sources with a union, Looker Studio drops identical rows. Two campaigns with the same name, date and numbers collapse into one, and the spend silently shrinks.
- Equality joins only. You can join on a date or campaign name, not on a date range or a lookup with conditions.
- Blends live in one report. You can't share a blend across reports, so the next dashboard rebuilds the same logic and drifts from the first.
The deeper problem is not the tool. "Conversion" means something different on every platform, and a blend hides that:
| Platform | What conversions counts in Weld's campaign model | Default attribution |
|---|---|---|
| Meta Ads | Purchases (the Ads Manager "Purchases" column, de-duplicated across web, app and offline) | 7-day click, 1-day view, as the connector requests |
| Google Ads | Primary conversion actions ("Include in Conversions"), can be fractional | Each action's own model and window |
| LinkedIn Ads | External website conversions, post-click plus post-view. Lead Gen Form leads are kept apart | Per conversion rule, 30-day click and 7-day view by default |
| TikTok Ads | The ad group's optimisation event (a purchase, a form submit or an install) | Set on the ad group |
Adding those into one "conversions" number is fine for a total, as long as everyone reading it knows it mixes purchases, leads and installs. Comparing CPA between Meta and LinkedIn is usually not fine. The dashboard should say which is which, and a model is the place to write that down once.
Currency is the last trap. Each ad account reports in its own currency, and Looker Studio will happily add euros to dollars.
The approach: one model, one table, one report

Weld's open-source SQL models for the ad platforms share a column contract. Each platform's campaign_performance_daily model starts with the same columns in the same order: date_day, account_id, account_name, currency, campaign_id, campaign_name, spend, impressions, clicks, conversions, conversion_value. That is what makes the stack a plain UNION ALL instead of a mapping exercise.
Step 1: Sync the ad platforms
Add each ad account as a data source in Weld and let the first sync finish. The setup guides list what each connector syncs: Facebook Ads, Google Ads, LinkedIn Ads and TikTok Ads.
Step 2: Add the campaign models
For each platform, add its campaign_performance_daily model:
- Facebook Ads campaign performance daily
- Google Ads campaign performance daily
- LinkedIn Ads campaign performance daily
- TikTok Ads campaign performance daily
Use the campaign models, not the ad models, as the base of the dashboard. Google's ad level report has no rows for Performance Max and Smart campaigns, so only the campaign report ties to account spend. Each model page shows the staging models it depends on; deploy them together, and the {{staging...}} and {{core...}} references resolve to the matching folders in Weld.
Step 3: Stack them into one model
Create a new model, for example paid_campaigns_daily in a marketing folder. The references below follow the folders the platform models deploy into, a core folder with one subfolder per platform; adjust them if you chose others. The SQL is BigQuery syntax. See Data models for how references work.
1with
2    stacked as (
3        select
4            'Meta' as channel
5          , date_day
6          , account_id
7          , account_name
8          , currency
9          , campaign_id
10          , campaign_name
11          , spend
12          , impressions
13          , clicks
14          , conversions
15          , conversion_value
16        from
17            {{core.facebook_ads.campaign_performance_daily}}
18        union all
19        select
20            'Google' as channel
21          , date_day
22          , account_id
23          , account_name
24          , currency
25          , campaign_id
26          , campaign_name
27          , spend
28          , impressions
29          , clicks
30          , conversions
31          , conversion_value
32        from
33            {{core.google_ads.campaign_performance_daily}}
34        union all
35        select
36            'LinkedIn' as channel
37          , date_day
38          , account_id
39          , account_name
40          , currency
41          , campaign_id
42          , campaign_name
43          , spend
44          , impressions
45          , clicks
46          , conversions
47          , conversion_value
48        from
49            {{core.linkedin_ads.campaign_performance_daily}}
50        union all
51        select
52            'TikTok' as channel
53          , date_day
54          , account_id
55          , account_name
56          , currency
57          , campaign_id
58          , campaign_name
59          , spend
60          , impressions
61          , clicks
62          , conversions
63          , conversion_value
64        from
65            {{core.tiktok_ads.campaign_performance_daily}}
66    )
67select
68    s.channel
69  , s.date_day
70  , s.account_id
71  , s.account_name
72  , s.campaign_id
73  , s.campaign_name
74  , s.currency as original_currency
75  , -- EUR needs no rate. Any other currency without a rate stays NULL, so a
76    -- gap in the rate table shows up instead of passing as euros.
77    s.spend * if(s.currency = 'EUR', 1, fx.rate_to_eur) as spend_eur
78  , s.conversion_value * if(s.currency = 'EUR', 1, fx.rate_to_eur) as conversion_value_eur
79  , s.impressions
80  , s.clicks
81  , s.conversions
82from
83    stacked as s
84    left join {{marketing.fx_rates_daily}} as fx on fx.currency = s.currency
85    and fx.date_day = s.date_day
Three choices in that SQL are worth keeping:
union all, notunion.unionremoves duplicate rows, the same problem as the Looker Studio blend.- A
channelcolumn. It becomes the main dimension in the report. - One reporting currency.
fx_rates_dailystands for any daily exchange-rate table you keep, with one row per currency and day. A currency with no rate for the day gives a NULLspend_eur, never a 1:1 guess, so check for it after each run:select * from {{marketing.paid_campaigns_daily}} where spend_eur is null and original_currency is not null. If every account already bills in the same currency, drop the join and keepcurrencyas a column so a second currency can't slip in unnoticed.
Publish the model as a table and add it to an orchestration after the ad syncs, so it rebuilds once the new data has landed.
Step 4: Give Looker Studio read-only access
Looker Studio reads straight from your BigQuery or Snowflake warehouse. Create a read-only identity for it, separate from the one Weld syncs with, and connect to the paid_campaigns_daily table. The Looker Studio guide has the exact BigQuery roles, the Snowflake grants and where Weld puts each model.
On Weld managed BigQuery you can't connect BI tools directly. Either migrate to your own BigQuery project, or send the model to Google Sheets with a reverse ETL sync and point Looker Studio at the sheet. Keep the sheet at campaign and day grain: a spreadsheet tops out at 10 million cells.
Step 5: Build the report
In the data source, add calculated fields for the rates, so Looker Studio computes them as ratios of sums at whatever level the chart shows:
ROAS = SUM(conversion_value_eur) / SUM(spend_eur)
CPA  = SUM(spend_eur) / SUM(conversions)
CPC  = SUM(spend_eur) / SUM(clicks)
CTR  = SUM(clicks) / SUM(impressions)
CPM  = SUM(spend_eur) / SUM(impressions) * 1000
A layout that works for a weekly review:
- Scorecards across the top: spend, conversion value, ROAS, conversions, CPA, each with the comparison to the previous period.
- Spend and ROAS over time, by week, with
channelas the breakdown. - Channel table: one row per channel with spend, conversions, CPA, conversion value and ROAS.
- Campaign table: the same columns per campaign, sorted by spend, so the biggest budgets get looked at first.
- Controls: a date range control and a drop-down on
channel.
Looker Studio caches BigQuery results for 12 hours by default. If the team checks the dashboard more often than that, lower the data freshness setting on the data source.
Worked example: one week, three channels
Here is one week from a fictional online store running Meta, Google and TikTok, already in one currency.
| Channel | Spend | Clicks | Conversions | Conversion value | CPA | ROAS |
|---|---|---|---|---|---|---|
| Meta | 4,200 | 6,000 | 140 | 15,960 | 30.00 | 3.80 |
| 3,100 | 2,480 | 93 | 12,090 | 33.33 | 3.90 | |
| TikTok | 1,200 | 3,000 | 30 | 2,700 | 40.00 | 2.25 |
| Total | 8,500 | 11,480 | 263 | 30,750 | 32.32 | 3.62 |
The totals row is computed the right way: 30,750 / 8,500 = 3.62 ROAS and 8,500 / 263 = 32.32 CPA.
Now the two mistakes a blended report tends to make:
- Averaging the channel rates. The average of 3.80, 3.90 and 2.25 is 3.32, not 3.62. The average of the three CPAs is 34.44, not 32.32. TikTok's small budget gets the same weight as Meta's large one, and the dashboard reports a worse week than the one you had.
- Losing a duplicate row. Say Google ran two campaigns called "Brand" in two accounts, each with 600 spend and 18 conversions on the same day. A union collapses them into one row. The week then shows 7,900 spend instead of 8,500, and every rate built on it is wrong by a number nobody notices.
The model above avoids both: union all keeps every row, and the calculated fields divide sums.
To check the model against the platforms, run this after each change and compare it with the totals in each Ads Manager for the same dates:
1select
2    channel
3  , sum(spend_eur) as spend
4  , sum(conversions) as conversions
5  , sum(conversion_value_eur) as conversion_value
6  , safe_divide(sum(conversion_value_eur), sum(spend_eur)) as roas
7from
8    {{marketing.paid_campaigns_daily}}
9where
10    date_day between date_sub(current_date(), interval 8 day) and date_sub(current_date(), interval 2 day)
11group by
12    channel
13order by
14    spend desc
The window stops two days back on purpose. Platforms keep restating recent days as late conversions arrive. Snapchat, for example, restates until about 48 hours after the day ends, and Meta's purchases move within their attribution window. Compare closed days, not today.
Common problems and fixes
- Spend lower than Ads Manager for Google. You built on the ad level model. Switch to
campaign_performance_daily, which includes Performance Max. - ROAS jumps when you change the date range. A chart uses a stored rate column or an average. Replace it with a calculated field that divides sums.
- Totals in the wrong currency. An account reports in a currency your rate table doesn't cover, so its spend is NULL and drops out of the sums. Find the rows with
spend_eur is null, checkoriginal_currency, and fill the gap in your rate table. - Last few days look weak. Conversions are still arriving. Show a note on the dashboard, or end the default date range two days back.
- Report is slow. Looker Studio queries the table on every interaction. Publish the model as a table rather than a view, and keep it at campaign and day grain.
Extending the dashboard
Once the paid view works, the same model is the base for the questions that come next:
- Add revenue you trust. Join orders from Shopify or Stripe by date and UTM campaign to compare platform-reported value with real revenue.
- Add more channels. Weld has the same campaign model for Microsoft Ads, Pinterest Ads and Snapchat Ads. Each is one more
union allblock. - Send it to the team's tools. The same table can go to Google Sheets or Slack with reverse ETL, so the weekly numbers reach people who never open Looker Studio.
For the wider picture of marketing data, see marketing analytics with a data warehouse.
FAQ
Looker Studio has no connector built by Google for Meta. You can use a paid partner connector, or sync Meta Ads into BigQuery or Snowflake and connect Looker Studio to the warehouse with Google's own BigQuery or Snowflake connector. The warehouse route lets you combine Meta with the other platforms in one table.
The same way as Meta: a partner connector, or a sync into your warehouse that Looker Studio reads. With several platforms, the warehouse route avoids one paid connector per platform and lets you stack them in one model.
Up to five data sources or tables per blend. Blends also support only equality joins, a union drops duplicate rows, and a blend can't be shared across reports.
Usually because the report averages per-channel or per-day ROAS instead of dividing total conversion value by total spend, or because a union removed duplicate rows. Check the attribution settings too: each platform counts conversions under its own windows.
For BigQuery, Looker Studio caches results for 12 hours by default. You can lower the data freshness setting on the data source down to minutes, at the cost of more queries against your warehouse.
Yes, with one partner connector per platform and blends, as long as you stay within five sources and watch the averaging and union traps above. Once you add a fourth platform, a currency, or revenue from your store, a single model in a warehouse is simpler to keep right.