What is Net Revenue Retention (NRR) and how do you calculate it?

Net Revenue Retention (or Dollar Retention) more commonly known as NRR is a metric most widely used in Software-as-a-Service (SaaS) businesses. It's measured as a percentage of revenue in a specific period like monthly, quarterly, or annually and will measure how efficient you are at generating additional revenue from existing customers by factoring in expansions, contractions, and churns - in other words how effective your company is at retaining its revenue from its customers over time.
NRR is also a great way to track customer satisfaction and loyalty. It's often overlooked how much revenue can be generated from existing customers, especially when you are at scale - it's not uncommon that the majority of your revenue will come from existing customers. You will also find that it's a lot easier and less expensive to sell to existing customers than acquire new ones - in particular as you get bigger.
As a result, having an NRR above 100 is really important for growth because:
1) it's compounding and;
2) an NRR below 100 will have to be offset by net new sales to keep your business growing
How do you calculate NRR?
Let's' start by outlining the difference between NRR and Gross Revenue Retention (GRR) as these two often get confused. GRR, only measures which part of the initial revenue existing customers renew and thus does not account for upsells or cross-sell. Therefore GRR can never be higher than 100 and anything less is down-sells or churns. Therefore NRR is a much better metric because it factors in everything.
Let's start with the standard formula. t0 defines the starting period and t1 defines the ending period.
NRR = MRR(t1) / MRR(t0)
Tip: It's important that you include the same cohort of customers in the starting period t0 and ending period t1.
Next, we dissect MRR(t1) by taking the MRR(t0) in starting period + all changes in MRR (t1) from the ending period.
NRR = MRR(t0) + Changes in MRR(t1) / MRR(t0)
In our previous article describing MRR we defined that changes from existing customers could include:
- Expansion MRR (also called upgrades, cross-sells, or upsells)
- Contraction MRR (also called downgrades or down-sells)
- Churn MRR (customers who cancel their subscription)
And then we can write the full formula:
NRR = MRR(t0) + Expansion MRR(t1) - Contraction MRR(t1) - Churn MRR(t1) / MRR(t0)
NRR example
Let's look at an example. Say you have 100 customers in starting period (t0) paying on average €1,000 / month in subscription fees. Then starting period MRR(t0) is the following:
MRR(t0) = 100 * €1,000 = €100,000
Now let's calculate the ending period MRR(t1) and assume that we had:
- €40,000 in Expansion MRR,
- €20,000 in Contraction MRR, and;
- €10,000 in Churn MRR.
This will give us the following:
NRR = (€100,000 + €40,000 - €20,000 - €10,000) / €100,000
We can then sum up the left side like this and multiply by 100 to get the percentage change:
NRR = (€110,000 / €100,000) * 100 = 110%
The best SaaS companies have 120%+ NRR. If you have less than 100% then you are leaking revenue which could be the symptom of a more serious underlying problem with your customer satisfaction, product, customer service, or something else. Therefore it's vital to keep track of your NRR and analyze it from different angles, timeframes, and cohorts to help understand whether it's a general trend or a trend within parts of your customer base. This we will talk about next.
How to analyze NRR?
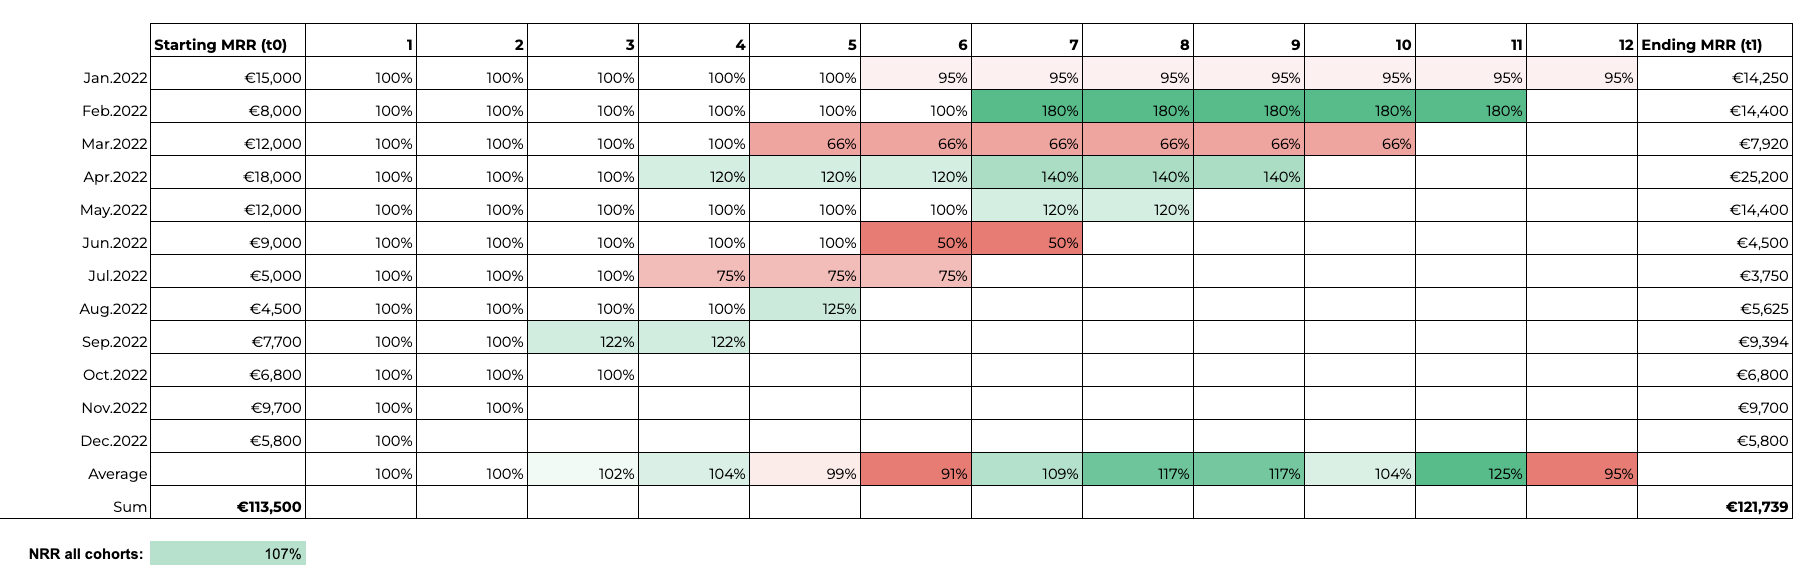
It's important to break your customers into cohorts based on when they were onboarded. This should be done on a weekly, monthly, quarterly, and annual basis. Below is an example of all cohorts of new customers in 2022 broken down by month. By visualizing your cohorts like this you can quickly identify problems for individual cohorts and general trends and act on those proactively.
Also, note that less than a year might not be enough time to truly understand how your cohorts perform so you might need at least 12 months based on your typical contract length and pricing model. Its also a good idea to include a 24 and 36 months view as well.
Tip: You can add additional filters like Country, Campaign, Channel (Outbound/Inbound), and Segment/Size to better understand different subsets of customers
Finally, keep in mind that Logo Retention is not the same as NRR as it's defined by the number of logos you retain to reach the cohort, and as with GRR can never be more than 100%.
Common pitfalls
1. Not looking at NRR from a cohort perspective
While it can be helpful to look at your NRR from a high-level perspective like all customers who had an active subscription in month X and then compare it to month Y you risk that the healthier cohorts will hide problems in unhealthy cohorts. As an example, it could be that younger cohorts generally perform a lot better but you have the problem that a significant part of your customers will churn over time, but because you are growing fast and maybe spending quite a bit of capital on that growth it will not be noticed immediately. Make sure to cohort on a monthly or even weekly basis when analyzing NRR.
2. Not having a clear definition of your cohorts
It's important to have a very clear definition of “when” a customer becomes a customer and thus belongs to an individual cohort. Mixing this up will make it hard to compare cohorts against each other. This also apply if you cohort on other dimensions like country, channel or size.
3. Mixing up NRR, GRR, and Logo retention
This one is quite obvious but it's important to understand the difference between these three metrics. As mentioned before NRR is by far the most useful but it can be helpful to calculate GRR and logo retention if you want to analyze retention from more perspectives and include more benchmarks for your overall retention performance.
4. Not collecting data on churn or downgrade
Make sure to capture all relevant feedback when customers churn or downgrade and try to assess whether you can do something about it. Maybe you need to revisit your value proposition, pricing strategy, ICP, or renewal process. This obviously also applies for expansions.
5. Not factoring in your typical contract length and pricing model
Lets say you only work with annual contracts. In that case then younger cohorts might look somewhat stable for the first year. The problem though is that you will only ever really know for those cohorts when renewal is up. This can obviously swing both ways but important to keep in mind. Here it can be a good idea to start the renewal discussions early (3 months+ before) and gather feedback and NPS to get a sense of whether churn or renewals are coming up and by how much.
Conclusion
A healthy NRR rate is vital for any SaaS business and not maintaining your NRR well above 100% will question your business model and value proposition as a subscription business. Therefore it's key to track NRR on a cohort and monthly level (based on when they became customers) to monitor how your cohorts develop and assess whether there are any important patterns that need to be addressed.
Continue reading

New connector alert 📣 - Fortnox
Weld now integrates with Fortnox, enabling Swedish businesses to sync key financial data effortlessly. Connect, configure, and start analyzing metrics like revenue, expenses, and customer value with ease.


How Danish Endurance boosted profitability by 77 % and transformed data management with Weld
Read the full story to see how Danish Endurance transformed its data strategy with Weld.


Weld + Shopify: Powering your ecommerce brand with data
Weld's Shopify integration is one of our most used connectors. Learn how it works and see real-world use cases for your ecommerce business.