
GROUP BY and ORDER BY
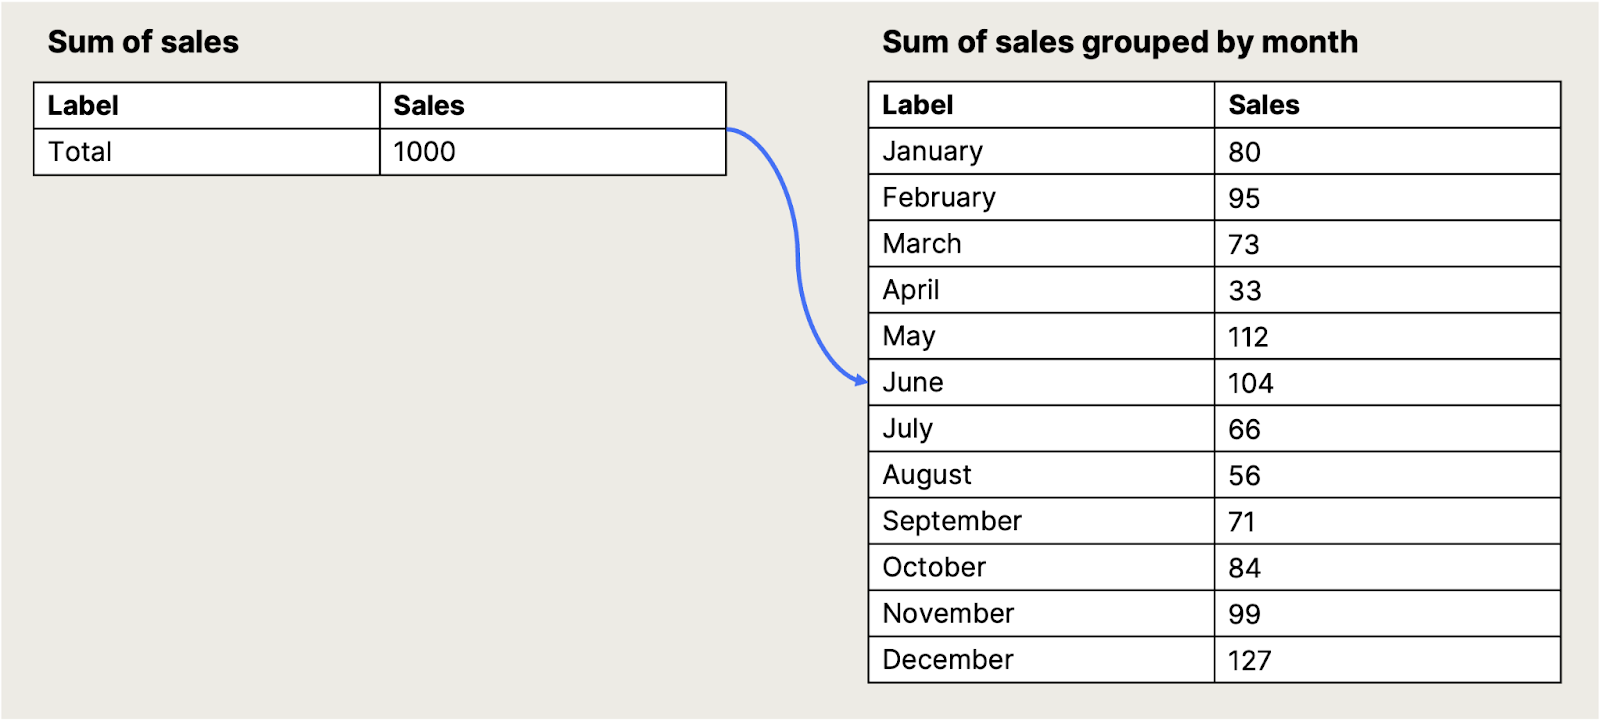
In the last section you learned how to make aggregations across the entire table, which enables you to get insights about the whole data sample. So you've now gone from looking at all rows in a table to being able to summarize all of these into one row. But sometimes there will be situations where you'll need to summarize the results on a level in between looking at all the rows in a table and only looking at one.
For example, you might want to:
- See the sum of your sales for each month
- Find the sales for each order
- Calculate the average sales for each customer.
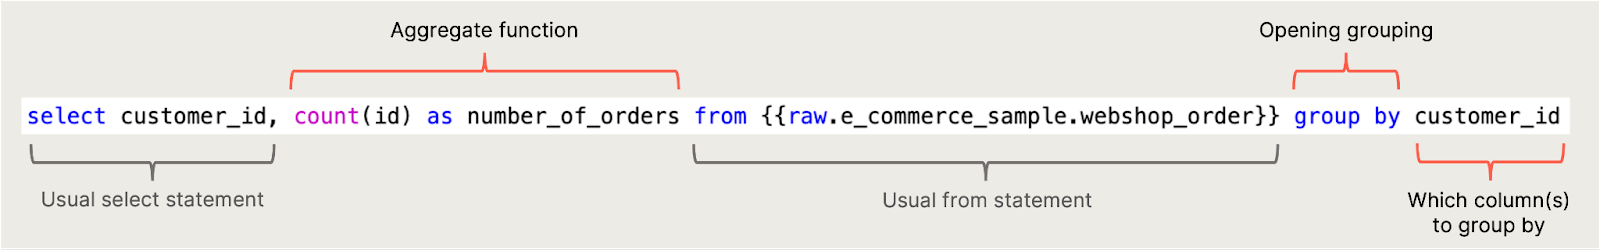
To do this, you want to use the aggregate functions on certain defined groupings. You can use the GROUP BY function to do this. For example, to find how many orders each customer has made:
See the query here:
1select
2    customer_id
3  , count(id) as number_of_orders
4from
5    {{raw.e_commerce_sample.webshop_order}}
6group by
7    customer_id
This is how the GROUP BY function works. You write your aggregate function as
you would otherwise, and then add the column(s) you want your resulting table to
be grouped by. For example, if you’d like to count how many orders you get per
year, a query to investigate this could look like this:
1select
2    count(id) as orders_received
3  , extract(
4        year
5        from
6            parse_date('%d / %m / %Y', received_at)
7    ) as received_at_year
8from
9    {{raw.e_commerce_sample.webshop_order}}
10group by
11    received_at_year
Just like before, you can use COUNT (id) on the Order table to count how many orders there are.
But now, you also want to see how many orders were placed each year — not just the total.
To do that:
- Create a new column that pulls out only the year from the
received_atdate. - After the
FROMstatement, add aGROUP BYto tell SQL how to group the results. - In this case, you group by the new year column (for example,
received_at_year).
Once you run the query, you’ll get one row per year — each showing the number of orders for that year.
If you try it on your own, the result would look like this:
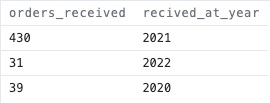
As you see, the result looks a little weird with a lot of orders in 2021 and few in 2020 and 2022. You can take a deeper look by adding another level of granularity:
1select
2 count(id) as orders_received
3 , extract(
4 month
5 from
6 parse_date('%d / %m / %Y', received_at)
7 ) as received_at_month
8 , extract(
9 year
10 from
11 parse_date('%d / %m / %Y', received_at)
12 ) as received_at_year
13from
14 {{raw.e_commerce_sample.webshop_order}}
15group by
16 received_at_year
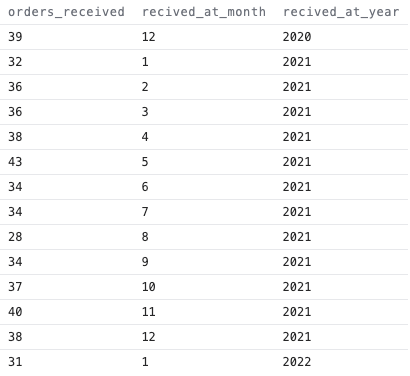
17 , received_at_monthThis time, add one more column extracting the month from the received_at date column, and group by this column. The result will look like this:
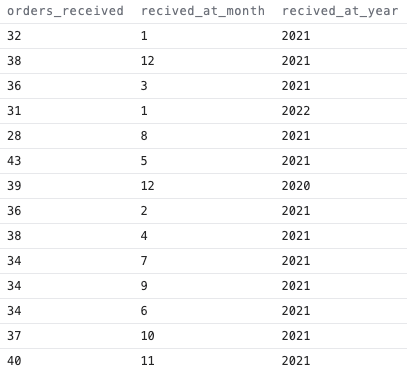
Now the 12th month in 2020 and the 1st month in 2022 are the only months included, so the result seems to make sense. And this is how the GROUP BY function works — defining which column(s) you’d like your aggregations to be grouped by.
The result of the grouped count of orders is a bit messy, and it would be nice to have the results ordered chronologically. You can use the ORDER BY function to define how you'd like the results ordered. This function is written similarly to the GROUP BY function and is simply added after the GROUP BY function. For example:
1select
2 count(id) as orders_received
3 , extract(
4 month
5 from
6 (parse_date('%d / %m / %Y', received_at))
7 ) as recived_at_month
8 , extract(
9 year
10 from
11 (parse_date('%d / %m / %Y', received_at))
12 ) as recived_at_year
13from
14 {{raw.e_commerce_sample.webshop_order}}
15group by
16 recived_at_year
17 , recived_at_month
18order by
19 recived_at_year
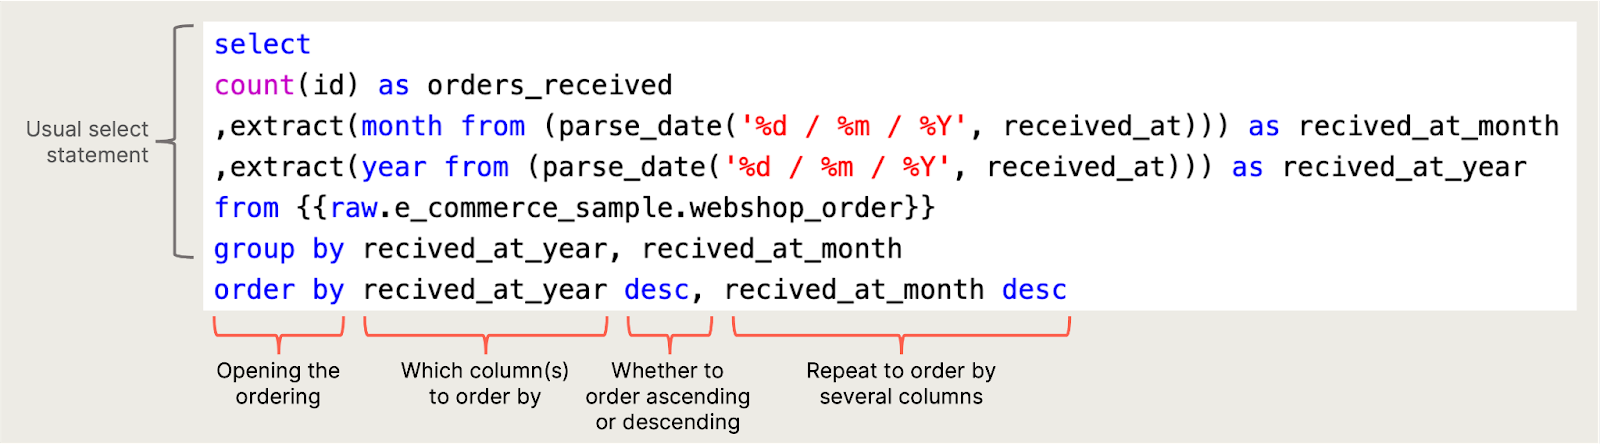
20 , recived_at_monthTo order the results by both year and month, add both to the ORDER BY statement. If you type this in the Weld Editor on your own, your result should look like this:
You can control how your results are sorted using the ORDER BY function by adding:
- ASC for ascending order (smallest to largest or A–Z)
- DESC for descending order (largest to smallest or Z–A)
By default, SQL uses ascending order. But if you want to reverse it, just add DESC.
For example, if you want to see the most recent year and month first, your ORDER BY clause could look like this:
The ORDER BY function statement not only works for aggregated data, it can also define the order of all rows in a table. If you want to play around with this, you can go back to some of the queries you wrote earlier.
Exercise 9: Find the total revenue for each order, and order it from largest to smallest
As mentioned earlier, looking at the highest value on individual order lines doesn’t give much insight—since each order can have multiple lines.
Now that you know how to use GROUP BY, you can instead calculate the total revenue per order to see which order was the largest.
To do this:
- Use the
order_idfrom theorder_linetable to group all the lines that belong to the same order. - Calculate the total revenue per order (e.g.
quantity * unit_price). - Use
ORDER BYto sort the results from highest to lowest revenue.
Your query will now show the largest orders at the top:
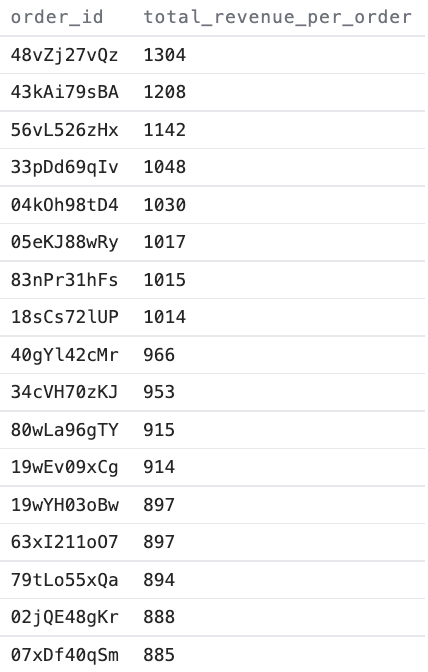
As you can see, the order with the highest value is the order with 48vZj27vQz as the id.
In SQL there are often many means to an end, so you’ll usually be able to get the required result by writing different variations of the same query. A simple way to solve the exercise above would be to write a query like this:
1select
2    order_id
3  , sum(quantity * price) as total_revenue_per_order
4from
5    {{raw.e_commerce_sample.webshop_order_line}}
6group by
7    order_id
8order by
9    total_revenue_per_order desc
💡 Adjusting for Different Currencies
You might have noticed from looking at the raw data, that the orders in the table are made in different currencies. To get a more accurate picture of the real revenue for the business, you'll need to convert all values into the same currency.
To do this:
- You'll need the currency exchange rates for the currencies used in the data.
- Once you have those, you can add a calculation to your query to convert each value.
- This allows you to see things like the total monthly revenue in a single, consistent currency.
If you’re up for a challenge, try to apply this in your own query to dig deeper into the sales performance.