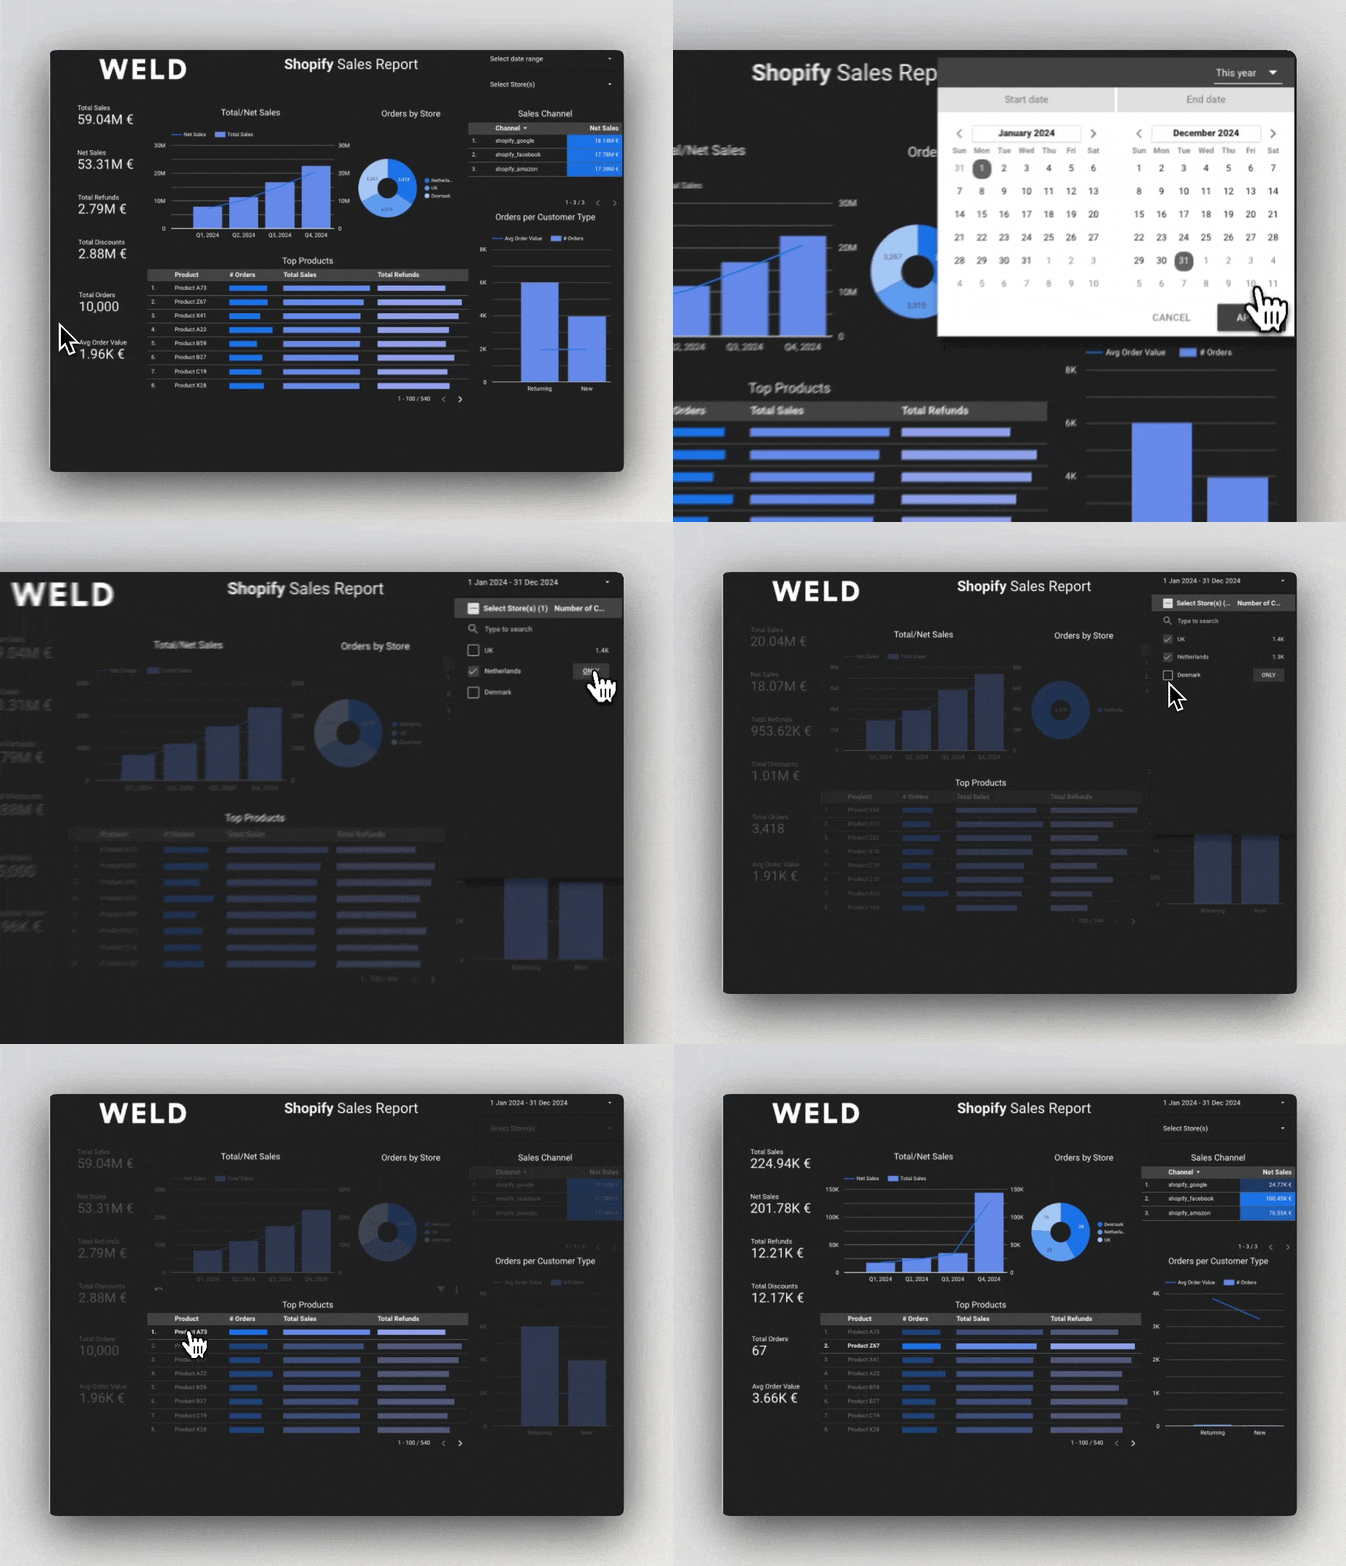
Managing data across multiple Shopify stores can be overwhelming. Tracking sales, customer data, and product performance often means dealing with disconnected tools and manual reporting.
With Weld and Looker Studio, you can create a centralized Shopify dashboard to simplify your data and gain clear insights. Using Weld’s pre-built template, you can set it up in no time.

Why use Looker Studio for Shopify reports?
Looker Studio provides an interactive way to visualize data, and with Weld, you can connect, transform, and sync your Shopify data seamlessly into a dashboard. By setting up this integration, you can track critical metrics like net sales, customer behavior, and product performance with ease.
While this guide focuses on Looker Studio, Weld also integrates with other BI tools such as Tableau and Power BI, giving you the flexibility to choose the platform that best suits your workflow.
🔧 Setup Guide
Before we dive in, make sure you have the following prerequisites:
- Shopify account: Access to the data you want to analyze.
- Looker Studio account: A Google Looker Studio account.
- Google Sheets spreadsheet: A destination to sync your Shopify data.
Step 1: Configure Shopify and Forex integrations
-
Set up Shopify integration: Follow our Shopify documentation to connect Shopify with Weld.
-
Set up Forex integration: Follow our Foreign Exchange Rates documentation to include foreign exchange rates for multi-currency insights.
Step 2: Set up the model
-
In your Weld account, go to Data Sources and select the Shopify integration. Click on the Shopify Report Dashboard SQL template, and press "Open template in editor".
-
In the editor, you can customize the template to fit your needs:
- Select the target currency in the config section.
- In store_data:
- Set up a store name;
- Set up the table references in the from section;
- If you want to add more stores, simply copy the select, from, and group by sections and paste them below the existing ones, using union all to combine them. For example:
1store_data as (
2    select
3        'Denmark' as store,
4        o.id as order_id,
5        ...
6    from
7        {{raw.shopify.order}} o
8        ...
9    group by
10        o.id, ...
11
12    union all
13    select
14        'UK' as store,
15        o.id as order_id,
16        ...
17    from
18        {{raw.shopify_UK.order}} o
19        ...
20    group by
21        o.id, ...
22    ),
23
Make sure to replace the table references with the correct ones for each store!
-
You can test the output of the template by pressing Run >.
-
Click on Publish to set up the model. Select the name and destination folder.
Step 3: Reverse ETL to Google Sheets
- In your Weld account, go to Reverse ETL and select + New.
- Select or create a new Google Sheets destination. You can find out more in our Google Sheets documentation.
- Select:
- The spreadsheet and the sheet where you want to sync the data to;
- Source Column Name as the template;
- Click Next.
- Select the Shopify model you created in the previous step and click Next.
- Choose how you want to sync the data and click Next.
- You can now select Auto Map to automatically map the columns in your model to the columns in your Google Sheets spreadsheet. Click Next.
- Finally, click on Create sync.
Step 4 - Prepare the data source in Looker Studio
- Visit the Looker Studio homepage and click on Create;
- Select Data source and click on Google Sheets;
- Select the spreadsheet and worksheet you created in the previous step and click on Connect;
- Give the data source a name on the top left;
- Make sure the fields' data types are correctly assigned:
| Field | Data Type |
|---|---|
| customer_id | Number |
| customer_type | Text |
| fulfillment_status | Text |
| net_sales_local | Number |
| net_sales_tgt | Number |
| order_date | Date & Time |
| order_id | Number |
| product_price_local | Number |
| product_quantity | Number |
| product_sales_local | Number |
| product_sales_tgt | Number |
| product_sold | Text |
| sales_channel | Text |
| store | Text |
| total_discounts_local | Number |
| total_discounts_tgt | Number |
| total_order_amount_local | Number |
| total_order_amount_tgt | Number |
| total_refunds_local | Number |
| total_refunds_tgt | Number |
| total_sales_local | Number |
| total_sales_tgt | Number |
Step 5 - Create the Looker dashboard
- Go to our premade Shopify dashboard;
- On the top right, select the three dots and click on Make a copy;
- In New Data source, select the data source you created on the previous step;
- Select the correct worksheet and click on Connect;
- Click on Copy Report to create your dashboard.
Step 6 - Customize the dashboard
You should now have a copy of the dashboard with the data from your Shopify account. You can customize it by adding new fields, changing the layout, or creating new visualizations.
Need more help setting up your dashboard?
Watch the full step-by-step guide:
Wrapping up
With Weld and Looker Studio, setting up a Shopify dashboard is straightforward and efficient. This integration empowers you to track and analyze critical business data, helping you make informed decisions and optimize your e-commerce performance.
Ready to get started? Follow this guide, and let us know how Weld can help take your data insights to the next level. 🚀


