
Sales forecasting, when done right, can help companies predict revenue, plan budgets, map out hiring plans, and much more. Teams that accurately model their sales often grow faster than those that don’t. The problem? Too few companies take the time to properly forecast their sales, or they do so using inaccurate or incomplete data models. The good news is that there’s a better, simpler way to do this right.
 Christian Sassano, in-house expert Data Analyst at Weld
On June 8th 2022, Christian Sassano, a Data Analyst on the Solutions Engineering team at Weld, went live to talk about better sales forecasting practices and how to craft a forecasting model using Weld’s in-house methodology. The enthusiastic audience asked pointed, insightful questions, and the session was engaging and informative. Here’s a recap of everything that was covered — the recording is provided below if you want to tune in!
Heads up: While executing the model requires knowledge of SQL, there are still plenty of learnings from the session for those who don’t have this technical skill set.
What was covered in the webinar:
- The difference between a forecast and a plan
- What to expect from your forecast
- What you need to create your forecasting model
- 3 key things the forecast model accounts for
- Seeing the bigger picture: how to use your forecast
The difference between a forecast and a plan
Christian launched the session by clearly defining the difference between a forecast and a plan. While these two ideas intersect and are often used interchangeably, it’s important to distinguish them. Here’s how he defines each one:
- A forecast is your best attempt to predict the future based on the data you have up to now.
- A plan is grounded in the forecast but also incorporates your vision for the future.
Both concepts are essential. Forecasting and strategic planning are critical components of a successful business, as Christian explained:
“You have to have both things. You have to have a strong understanding of the present moment and be grounded in reality. But you also need to be dreaming big, have a vision for the future, and believe in yourself and your team that you can do things that you can’t currently do — and that you can do things that nobody else can do.”
– Christian Sassano, Solutions Engineer at Weld
It’s important to balance the reality of the current situation with your aspirations for the future. To achieve that balance, you need a comprehensive understanding of your current reality — and that’s the ultimate goal of the methodology outlined in this webinar.
What to expect from your forecast
According to Christian, there are two core things you can expect from your forecast:
- A clear view of your pace in relation to your forecast.
- Up-to-date predictions based on your most recent data.
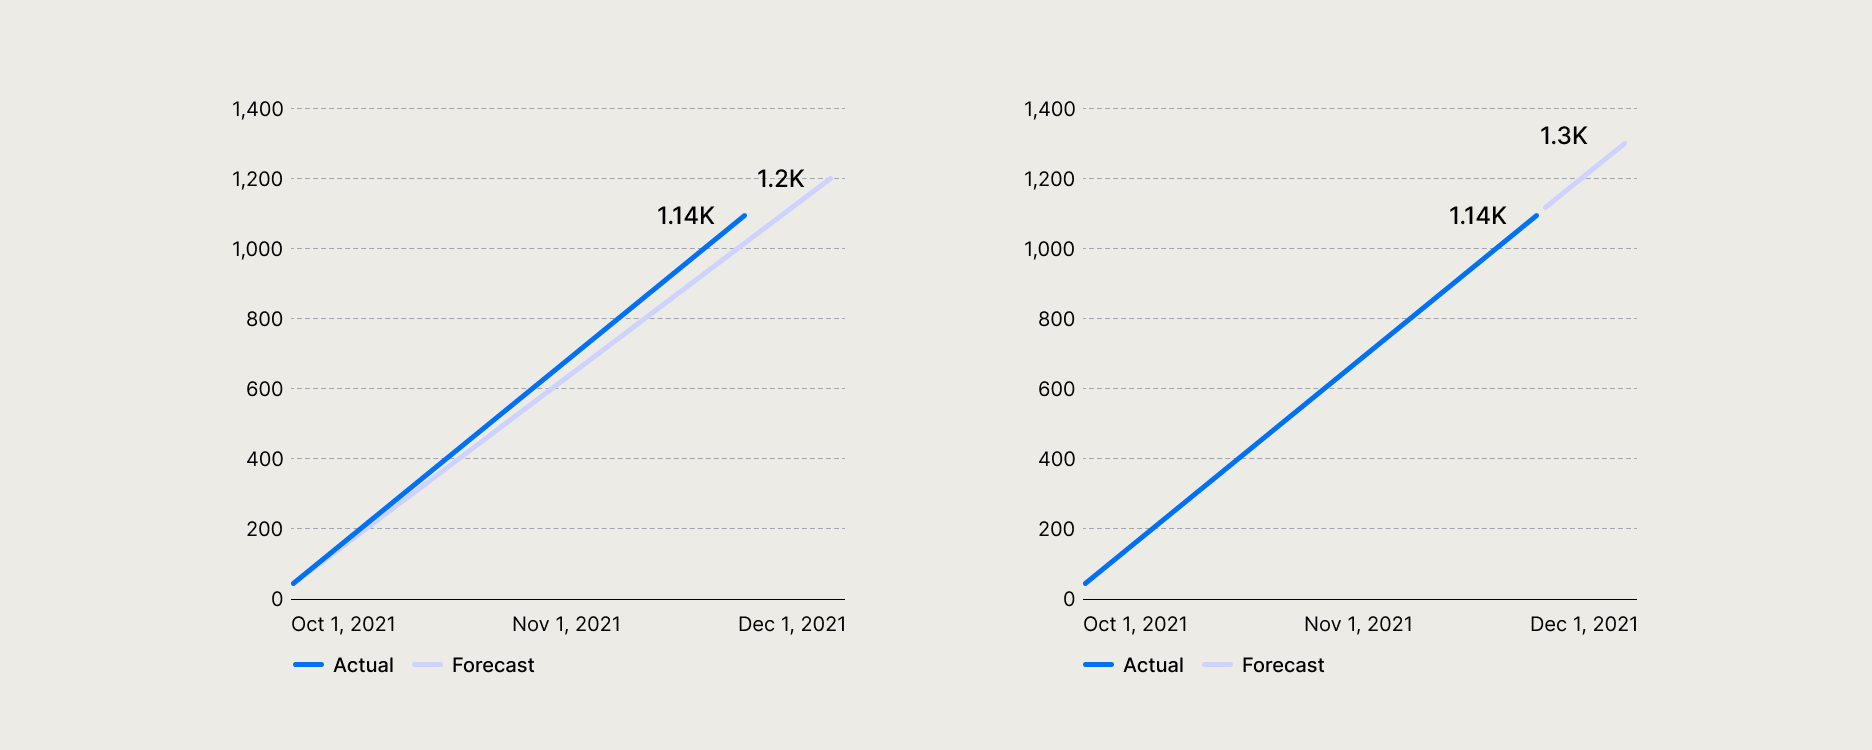 The graph on the left shows how you can measure your pace in relation to your forecast, and the graph on the right shows how your model will keep predictions up-to-date with your most recent data.
Measuring your performance against your forecast helps you understand whether you’re on track with your projection. As your actual performance is measured, your forecast will adjust to reflect any variance and remain updated based on your most recent data.
What you need to create your forecasting model
So, what information do you need to create an accurate sales forecast for your business? Christian shared the table and columns you’ll need for your model. The column inputs are as follows:
- Prospect ID
- Date Qualified
- Date Won
- Is Won
- Days to Won
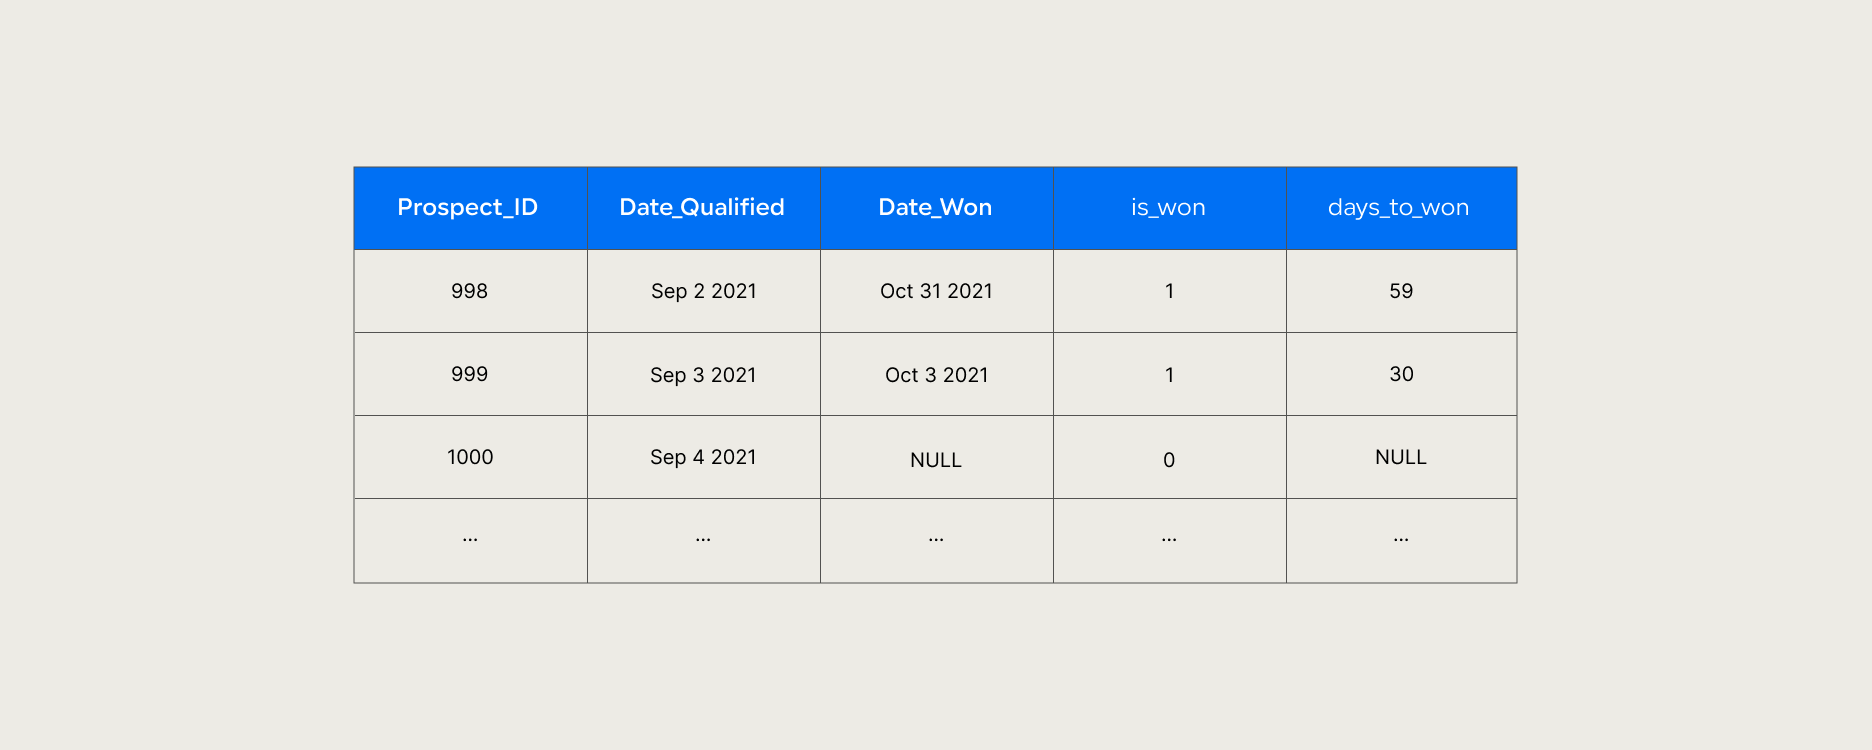 Here's an example of what your inputs table should look like
Ready to get started? Go ahead with Christian’s complete SQL sales forecasting model, designed to be customizable to various contexts. With the table above, you’ll have everything you need to start building your model.
The important thing to note is that these inputs may have different meanings depending on your business model and sales funnel. In particular, “Date Qualified” must be defined by you, because how you qualify your customers is unique to your company’s context. You may even have more than one way of qualifying customers. Christian encourages you to spend some time thinking this through:
“You have to have some level of intent. For us at Weld, that means when a meeting is booked and we see a potential customer, we create a deal and assign them to someone who will continue to interact with them. That deal created date tends to be what we use, because it implies that someone on our team is actively working to convert that person.”
– Christian Sassano, Solutions Engineer at Weld
Applying the methodology in a variety of contexts
Christian clarified that while this approach is typically used for sales teams, it can also be applied in other contexts. For example, in a commerce context, the model can forecast sales using the first interaction with the web store or initial visit to a brick-and-mortar shop as the qualified date. Alternatively, it can be used to forecast returning customers by using the first purchase as the qualified date and the subsequent purchase as the win date.
3 Key Things the Forecast Model Accounts For
Beyond the basic inputs, Christian highlighted three critical factors that any robust forecasting model should consider:
1. The Length of Your Sales Funnel
Understanding the length of your sales funnel is crucial for building an accurate forecast. You should analyze your funnel from a cohort perspective using the date prospects entered the funnel as a reference. With a table containing your Prospect ID and Days to Won, you can create two essential visualizations:
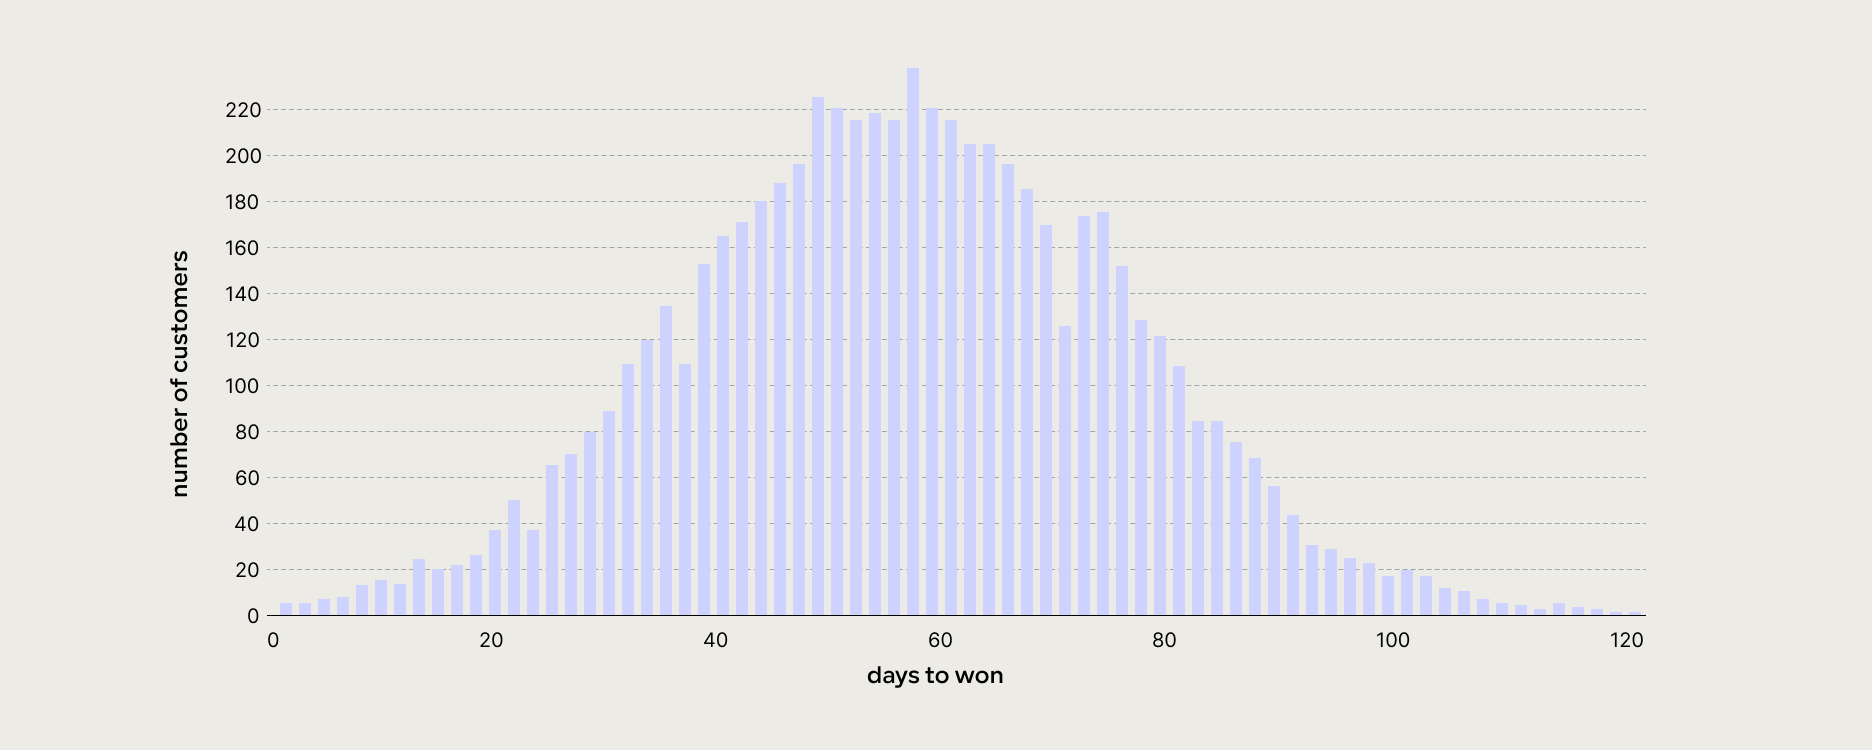 Graph One: Sales Funnel Length in days
The first graph shows the total number of customers won each day after entering your funnel, revealing trends such as a bell curve, multi-modal distribution, or skewed distribution.
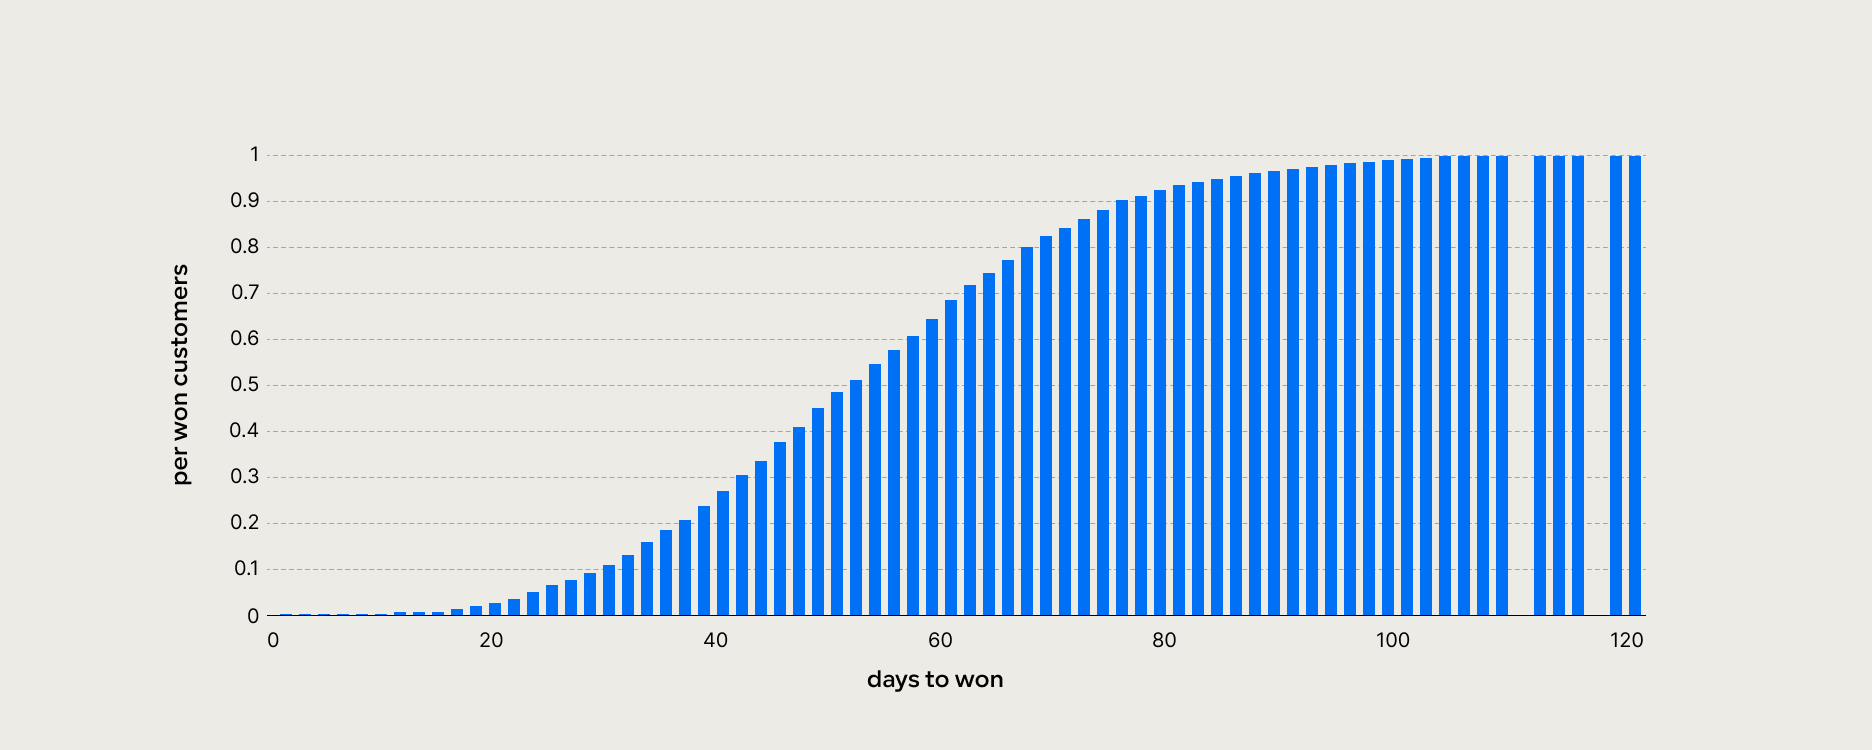 Graph Two: Sales Funnel Length by percentage
The second, cumulative graph shows the percentage of customers who have converted as the number of days increases.
These graphs help derive clear estimates, for example:
- 50% of customers are won within 30 days.
- 80% of sales take between 20 and 40 days to close.
Pro tip: If you have different customer segments with distinct sales funnels, add an extra “Customer Type” column to your inputs table. This allows you to run forecasts for each segment separately.
2. Your Overall Win Rate
The next key factor is your overall win rate. When viewing your sales funnel from a cohort perspective, you might notice your win rate dropping as you approach the current date—because prospects mid-funnel haven’t yet converted.
“You have to give your prospects time to convert. And if you do this, every time you look at your win rate per month up to the current date, it will look like it just fell off a cliff.”
– Christian Sassano, Solutions Engineer at Weld
To account for this, remove the most recent data representing prospects still mid-funnel, and calculate your win rate from the remaining data. Christian’s model takes the average of this remaining data and can be adjusted for factors like seasonality.
3. The Total Volume of Your Pipeline
Finally, estimate the total volume of prospects entering your pipeline in the future. This lets you apply your sales funnel length and win rate expectations to future prospects.
Christian’s model calculates a basic average volume from past data over a defined period, which could be:
- The 90 days leading up to the start of the forecast period, or
- The same period from the previous year.
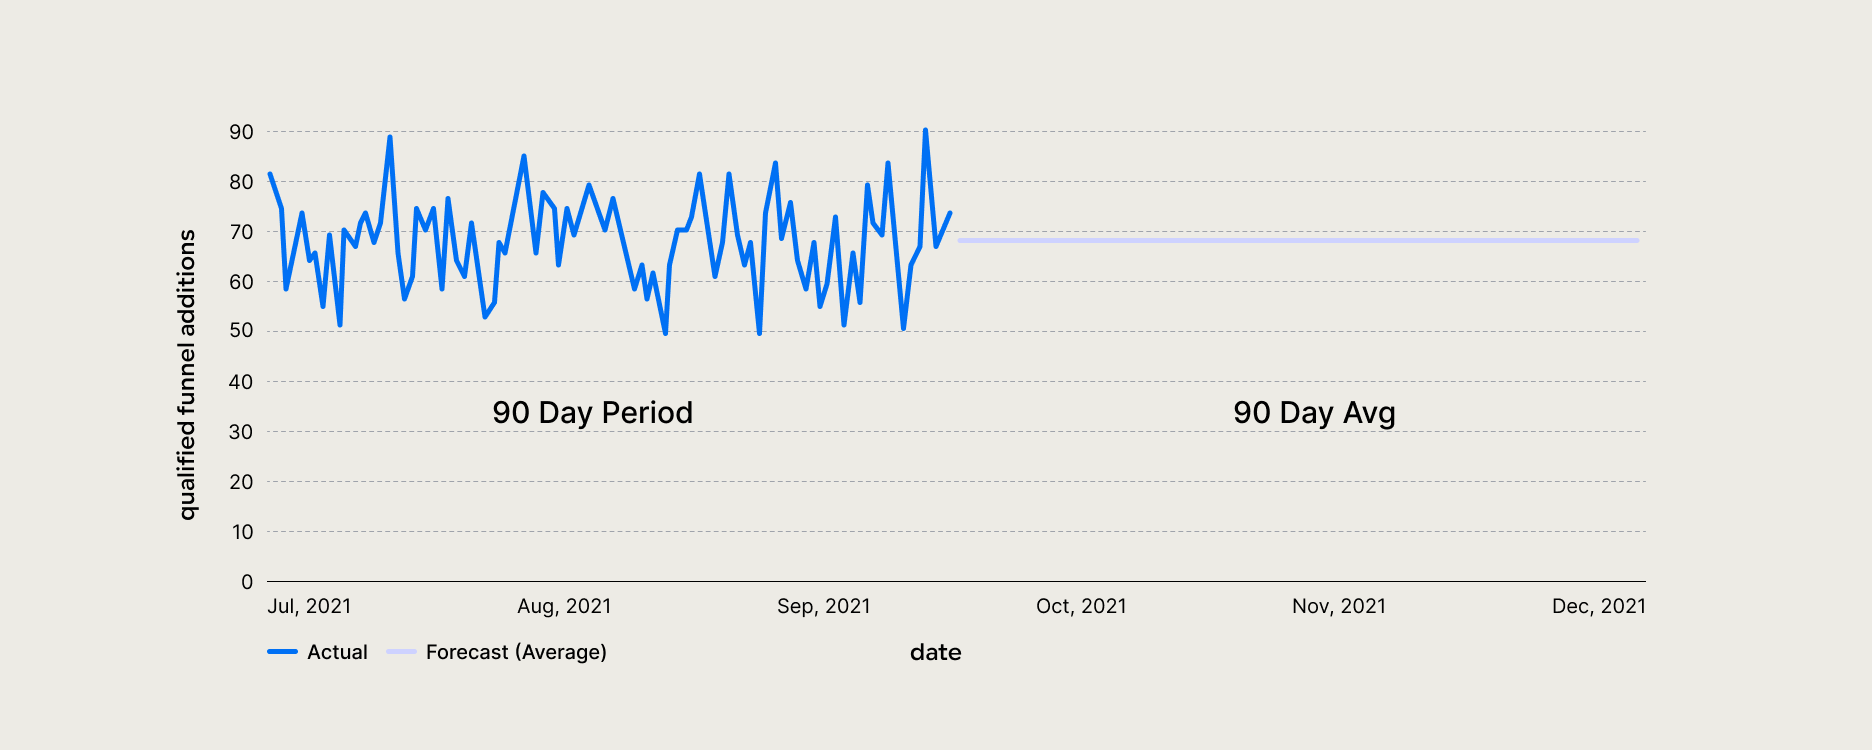 You can use an average of past volume to predict your future volume in your forecast.
“Whatever the case is, I do believe that you should give yourself a clear, singular line to work with. Simple estimates make clear assumptions.”
– Christian Sassano, Solutions Engineer at Weld
In other words, your volume estimate should be based on historical data, even if you plan for growth.
Seeing the Bigger Picture: How to Use Your Forecast
As the session wrapped up, Christian explained that your forecast helps you identify whether you’re speeding up, slowing down, or on track. Since the forecast accounts for your sales funnel, win rate, and total pipeline volume, it also pinpoints where variances occur.
For example: You might notice that your win rate is lower than projected. But before you double down on closing calls, you might see that your volume has increased and your funnel length has expanded—factors that could be affecting your sales team’s performance.
This insight informs your business strategy and helps you decide where to focus your team’s efforts. Your forecast serves as a baseline, while your plan reflects your goals. Once you’ve created a forecast and monitored your results, you’ll have the insights needed to craft your plan.
Three Assumptions Your Forecast Helps You Monitor
- Your top-funnel assumption: Are you bringing in the volume you anticipated based on prior performance?
- Your win rate assumption: How does your calculated win rate compare to your actual win rate over time?
- Your funnel length assumption: Are variations in your sales funnel length due to changes in your customer base?
Now that you have a deeper understanding of the methodology, you’re ready to move ahead with Christian’s complete SQL sales forecasting model, designed to be customizable to various contexts. With the inputs table above, you’ll have everything you need to get started.